The Nasdaq indices run to the upside is continuing with the price currently up 279 points or 1.45% at 19558.42. The high price reached 19560.11.
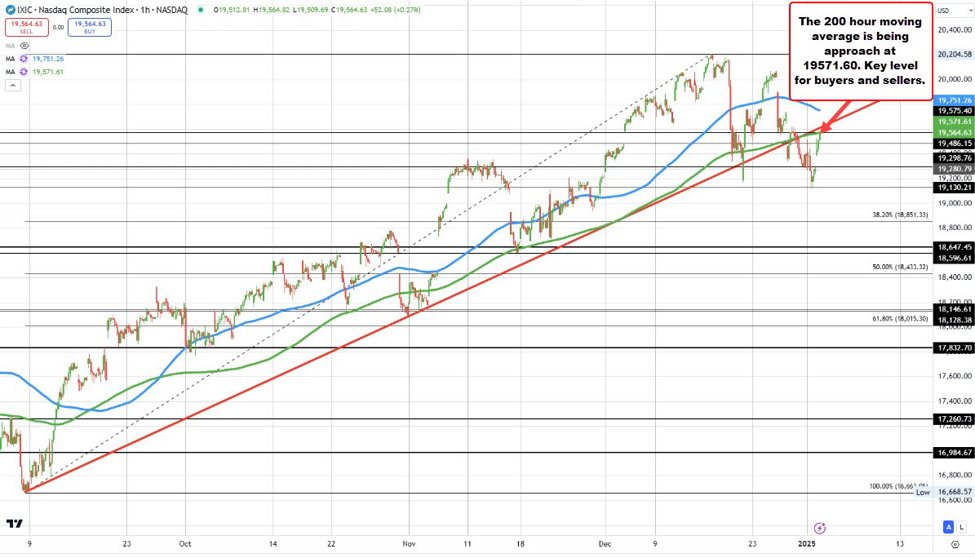
Looking at the hourly chart above, the price is also approaching its 200-hour moving average at 19571.58. The price fell below that moving average on December 30 and reached a low on January 2 at 19117.59 before modestly bouncing into the close yesterday.
Today the price gapped higher and has pushed to new highs off of better economic data.
The price just took another run to the upside to a new high of 19565.15.
Can the momentum continue with a move back above its 200 hour moving average? Or will sellers take advantage of the technical level to do some selling on the run higher today?
Risk can be defined and limited against the MA level. The level is a KEY barometer for both buyers and sellers today and going forward. .