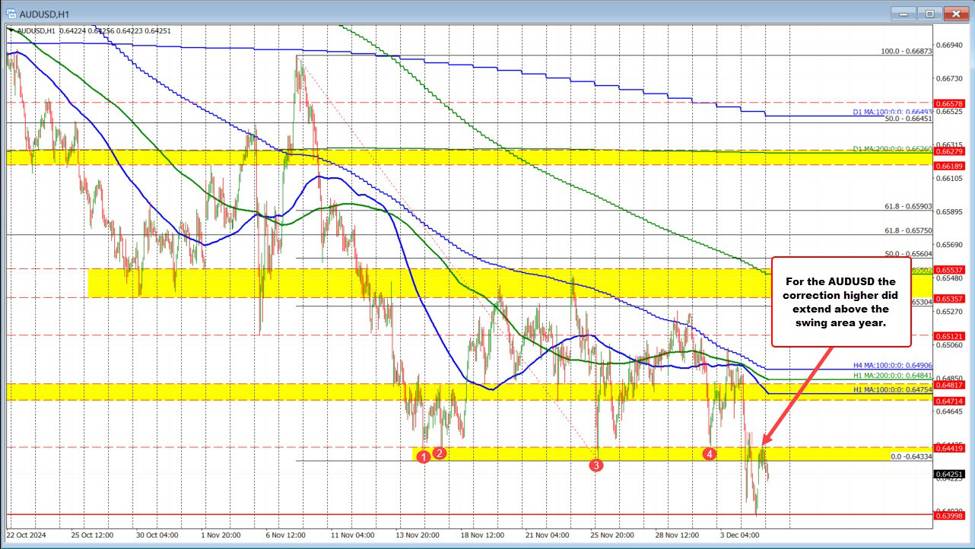
The AUDUSD moved sharply yesterday on the back of weaker Australia GDP data. The price broke below a floor area between 0.6433 and 0.6442
However, a sharp rebound took the price back above the swing area and to a high of 0.6450. The momentum cannot be sustained and when the price low back below the swing area the move lower took the price to a natural support at 0.6400 area. The bounce back in the US session on the USD selling saw the price move to the high of the swing area this time, where sellers leaned. That hold kept the sellers in control.
Going forward, if that swing area can keep a lid on the pair, the sellers would be in control and remain in control.
For traders, stay below and go lower.
For the NZDUSD the price action is very similar. The difference is on the snap back rebound yesterday, the price highs stalled on 2 seperate tests between 0.5859 to 0.58667. Also like the AUDUSD, if the price can stay below that swing area, the sellers can explore the downside more.