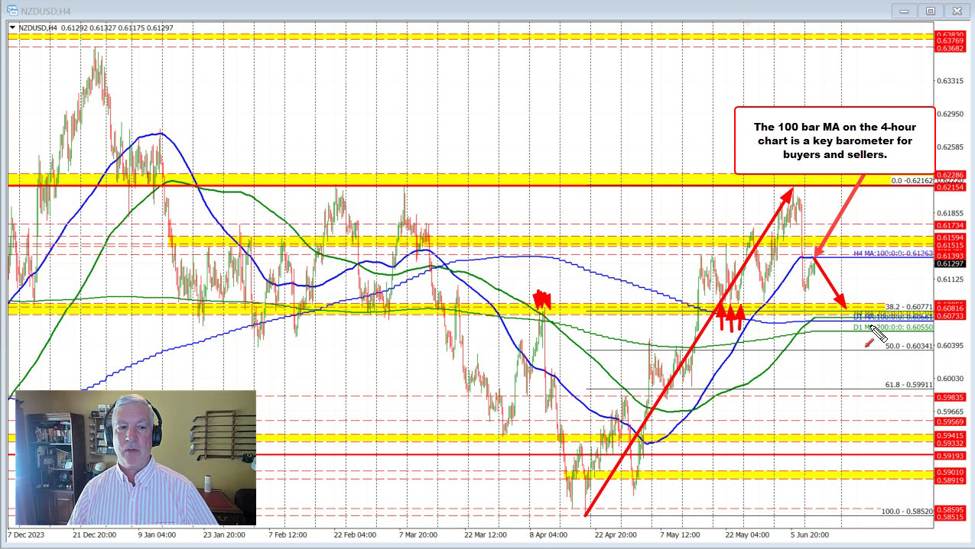
The NZDUSD fell sharply on Friday and fell below its 100-bar moving average on the 4-hour chart. That level comes in at 0.6136.
The first two days of the trading week has seen the price move up toward that moving average level. The price of the EURUSD got within four pips of it in trade today (so far). If that moving average can be breached, he would increase the bullish bias.
Conversely if seller’s lien against the level, and resumes the downward bias, that could lead toward a move down toward the 38.2% retracement of the move up from the April low.
NZDUSD moves higher and tests 100 bar MA on 4-hour chart
This article was originally published by Forexlive.com. Read the original article here.