The US stocks are moving back toward session lows. The NASDAQ in that this really trading at 15615. The low price reached 15595.74. At current levels the price is down -0.43%.
Nasdaq moves toward key support targets
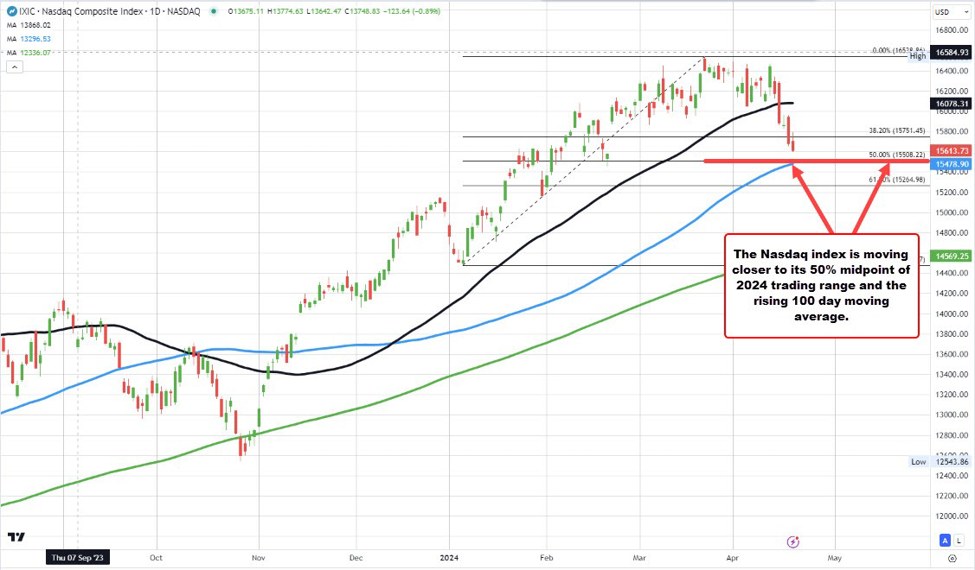
As the price was lower, it is getting closer to a key technical support level defined by the 50% midpoint of the 2024 trading range. That level comes in at 15508.22. Close to that level is the rising 100-day moving average at 15478.89. The price has not been below its 100 day moving average since November 10, 2023.
That area should be a tough nut to crack on a test.
The S&P index is currently down -0.20%. For the training week
For the trading week, the NASDAQ index is on pace for its worst week since September 18, 2023. Is currently down -3.42%. The S&P index is down -2.19% which is its worst week since October 23, 2023.
The Dow is the best performer, but it is still lower -0.67% on the week