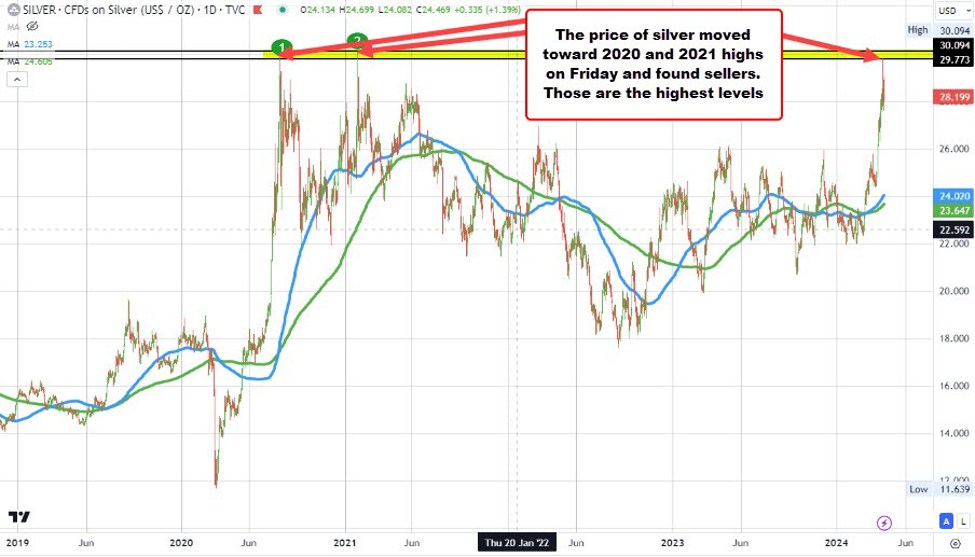
Silver on the daily chart
The price of silver moved to a high on Friday at $29.79. That got within $0.30 of the 2021 high at $30.09. The 2020 high reached $29.86. So there are 3 highs from 3 different years with $0.30. Those highs are the highest since 2013. Getting above them would open the door to the upside.
After reaching the high on Friday, the price started to rotate lower. That move day the price move below the 100 hour MA (blue line) and then the 38.2% of the move up from the March 2024 low (see hourly chart below). However, buyers came in against the 200-hour MA and bounced. The high price on Monday reached up to $29.01 before rotating back lower.
Today, the price once again fell below the 100-hour MA (blue line on the chart below), but found willing buyers at the 200-hour MA for the 2nd time this week (green line on chart below). Once again, buyers leaned and pushed the price higher.
So technically, the ceiling is clearly near $30. The technical support is near 200-hour MA (at $27.98).
Those technical levels gives traders the targets that need to be broken to either increase the bullish bias (on a break above $30), OR give the sellers some confirmation and confidence on a break below the rising 200-hour MA.
Be aware