NZDUSD looks back to the 200 hour MA
The NZDUSD stepped lower and is trading down for the 3rd consecutive day after a run above the 100-day moving average last week failed. (100-day moving averages at 0.62129).
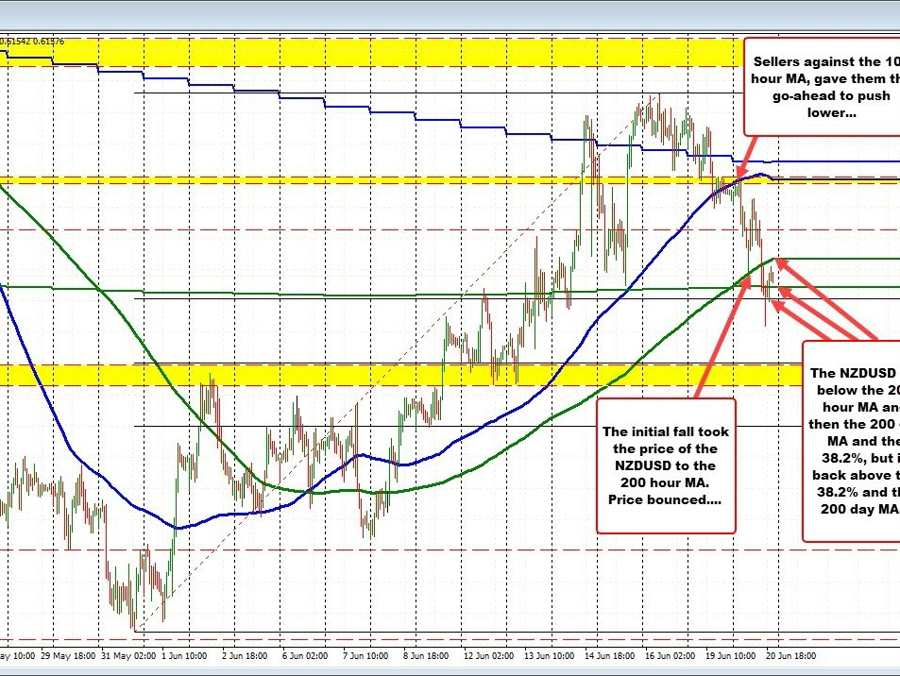
In trading today, the Asian session saw the price test its 100-hour moving average (currently at 0.62046). Sellers leaned against that level and it opened the door for more selling. The initial fall took the price to the 200-hour moving average (the green line on the chart above, currently at 0.61658). The price bounced off that level but resumed the fall in the US session.
That move to the downside tumbled below the
- 200-hour moving average (currently at 0.6166),
- 200-day moving average currently at 0.61522, and the
- 38.2% retracement of 0.61464.
The low price reached 0.61484 before bouncing higher over the last 4 -5 trading hours.
The price is now back up looking toward its 200-hour moving average (and back above the 200-day moving average as well). If the price can get back above the 200-hour moving average, sellers would be disappointed. Conversely, stay below and a rotation back below the 200-day moving average would open the door for more selling potential with the 50% midpoint at 0.61154 as the next target.