USDCAD below the 100 hour moving average
The better-than-expected Canada GDP brings the Bank of Canada back in play after their conditional pause in rate hike’s. That has the USDCAD moving lower.
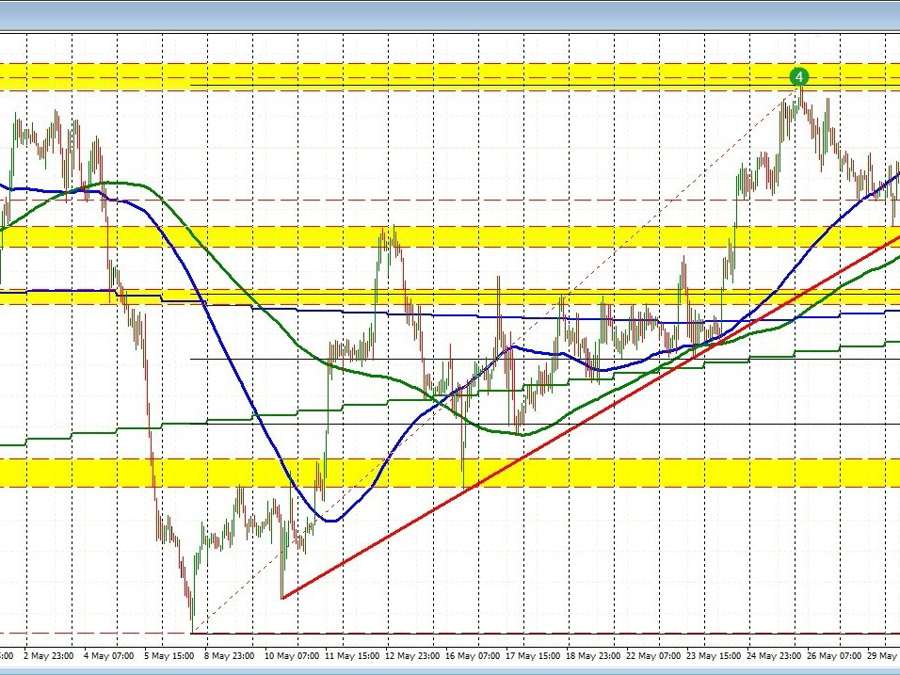
Technically, the price just broke below its 100 hour moving average at 1.3612. The current price trades at 1.3608. On the downside a rising trend line cuts across at 1.35825. Below that, and the rising 200 hour moving average comes into focus at 1.35679. The price tried to move below that moving average last Tuesday, but failed on the break fairly quickly and that started the move back to the upside (see green line on the chart above). Key target on the downside now.
In trading earlier today, the price tested the high price from last Friday (at 1.36539), but found willing sellers against that level. The inability to move above that level and through the swing area up to 1.3667, gave the sellers the go-ahead to push to the downside.
Sellers are making the play, but traders want to see momentum below the 100 hour moving average.