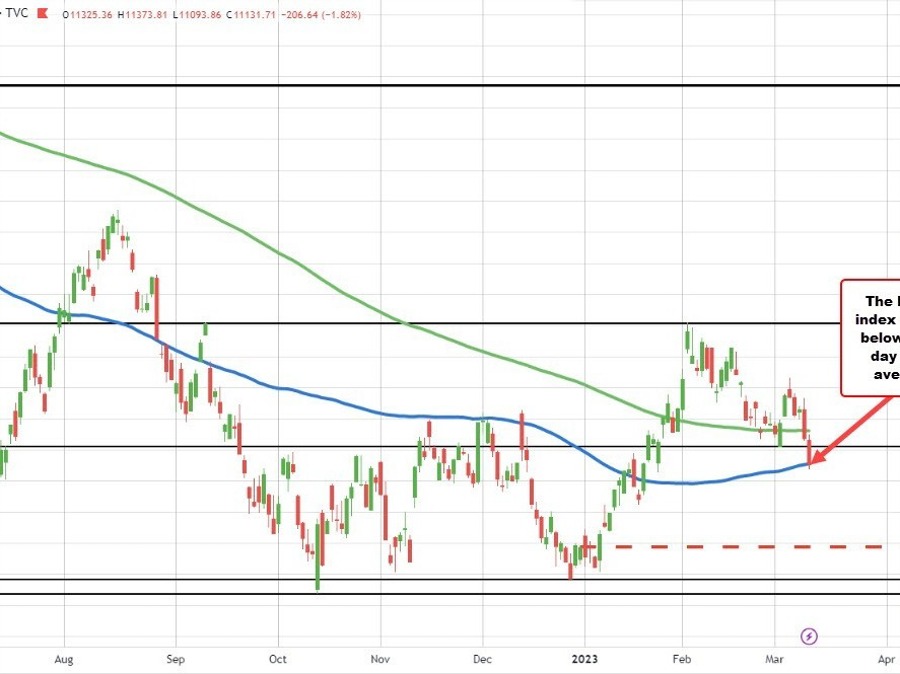
NASDAQ index is below is 100 day moving average
The NASDAQ index is now down over 200 points or -1.83%. For the week the index is down by -4.75%. That’s the worst week since October 31 when the index fell -5.65%.
Technically the price has dipped below the 100 day moving average at 11136.58. The current prices just below that level at 11131.71.
For the S&P index, it moved to a low today of 3846.32. That was within seven points of the closing level from December 30, 2022 at 3839.85. The S&P index is currently trading at 3859.28 down -58 points or -1.48%.
This article was originally published by Forexlive.com. Read the original article here.