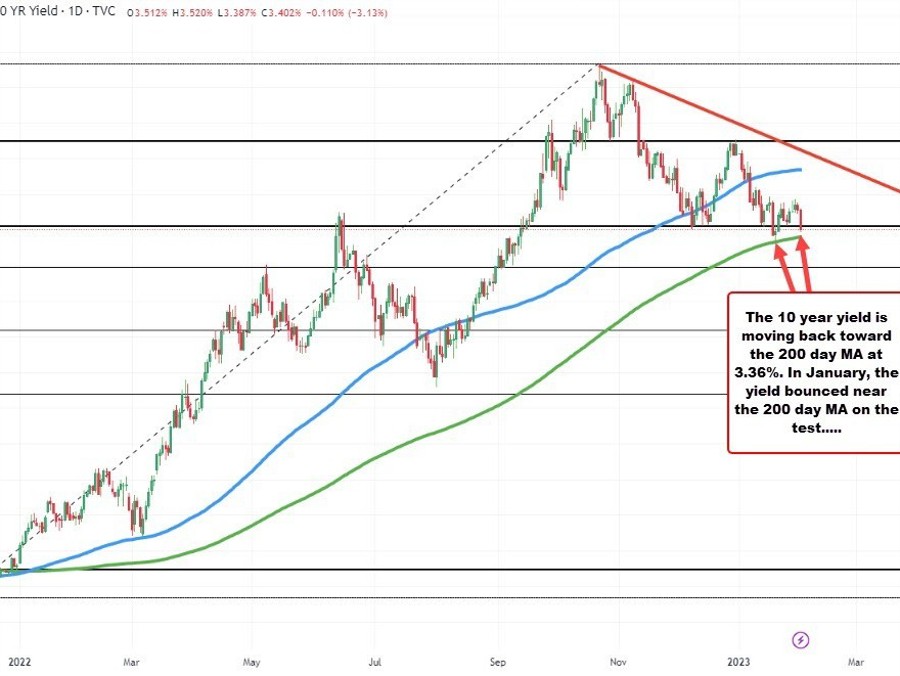
The benchmark 10 year yield in the US is moving closer to its rising 200 day moving average (see green line in the chart below).
Recall from January 19, the yield moved down to a low of 3.321%. The 200 day moving average was at 3.331% on that day. Momentum could not be sustained to the downside, and the yield moved back to the upside.
Today, the yield has reached a low of 3.387%. That’s down from a high reached on Monday at 3.574%. The rising 200 day moving average comes in at 3.360%.
Moving below the 200 day moving average – and the low from January at 3.321% – would open the door for the next downside target at the 38.2% retracement of the move up from the December 2021 low. That level comes in at 3.189%. Conversely hold support, and a move back above 3.42% could lead to some disappointment from those looking for lower rates.
Key area for both bulls and bears in the US debt market.
US 10 year yield is looking toward the 200 day MA at 3.36%