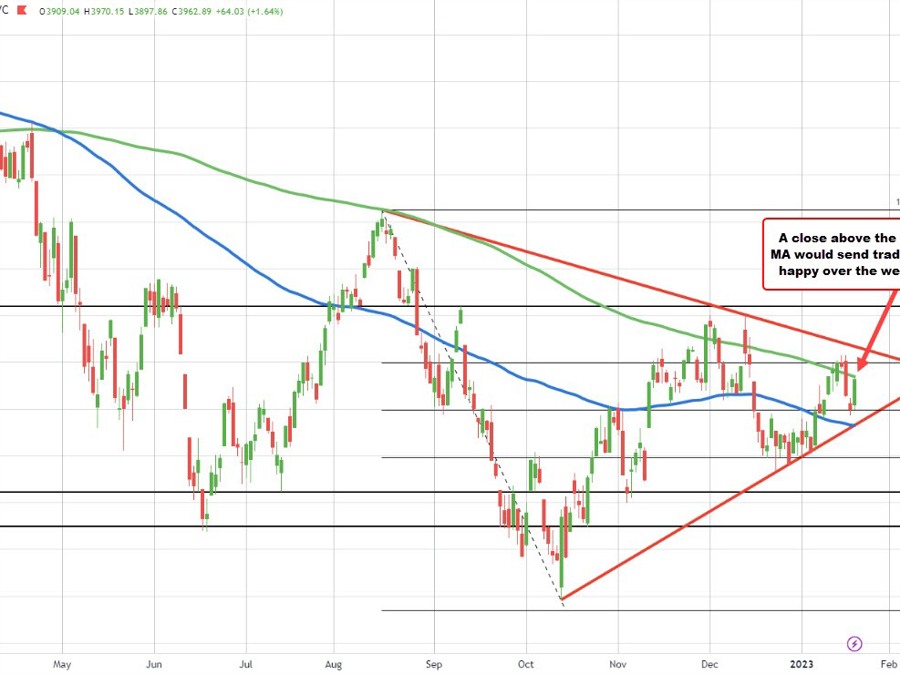
S&P retesting at 200 day moving average
As the trading day works toward the close, the S&P ticked briefly above its 200 day moving average at 3968.82. The high price reach 3970.15.
Recall from earlier this week, the price closed above the 200 day moving average on Monday and Tuesday, but stalled on Wednesday and fell sharply. The price reached down into 3885.54 yesterday, before starting to rebound in trading today. The low price today stalled against the 50% midpoint of the range since the mid August high. That level comes in at 3897.68. The low price today reached 3897.86 just above that midpoint level.
The current price is trading back below the 200 day moving average at 3962.58. We’ll see what the next 20 minutes brings.
Inflation
This article was originally published by Forexlive.com. Read the original article here.