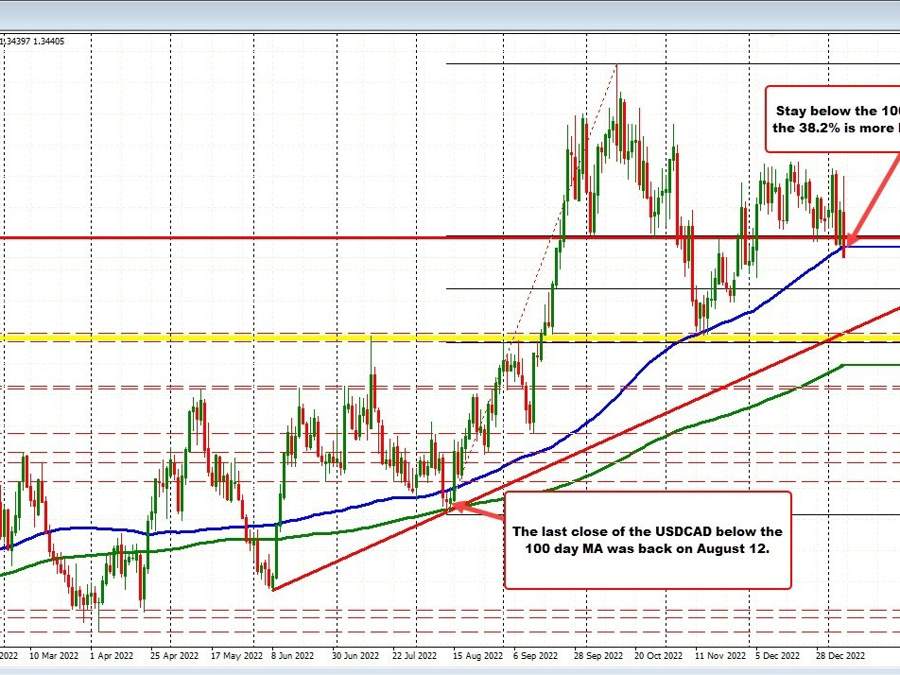
USDCAD price below the 100 day MA now
The USDCAD has moved below the 100 day MA and in doing so, is the first time since November 16. At that time, and the preceding day on November 15th, the break quickly failed and rotated/closed the day above the MA level. The last time the price closed below the 100 day MA was back on August 12.
Sellers are making a play. Stay below the 100 day MA, and the 38.2% of the move up from the low at 1.3499 (call it 1.3500), would give the sellers the edge technically.
This article was originally published by Forexlive.com. Read the original article here.