GBPUSD falls below the 200 day MA
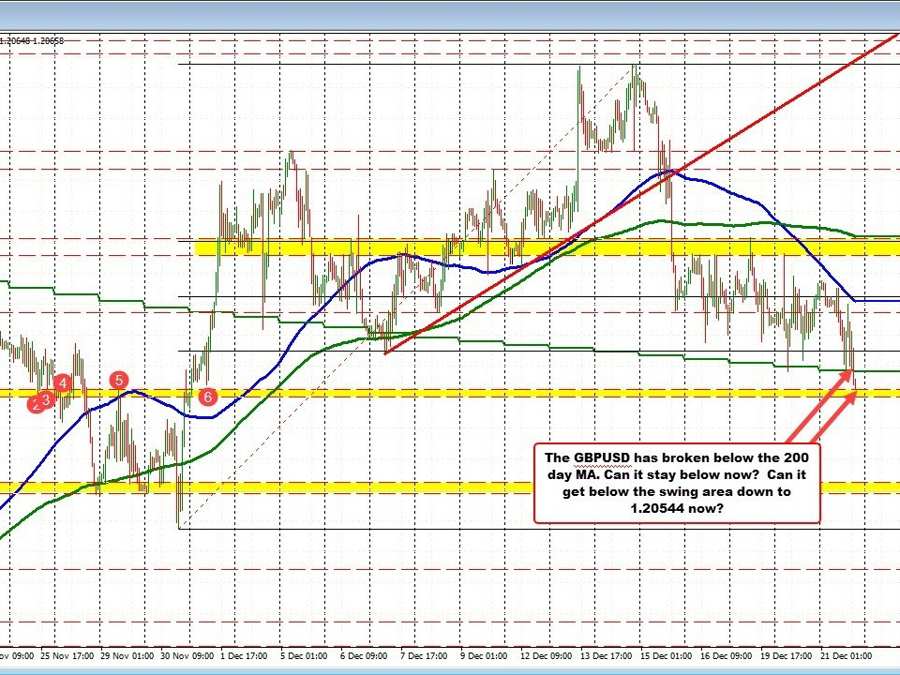
The GBPUSD has been skimming at lows in December near the 200 day MA (green overlay line on the chart above at 1.20846). The price tested that MA yesterday and again earlier today.
It just moved below that MA level, tilting the bias more to the downside. The next target on the hourly chart comes in between 1.2054 1.20635. Will below those levels and it opens the door for further downside.
Helping the bearish bias today was the holding below the 100 hour MA (blue line in the chart above). That selling kept the sellers in control despite the ups and downs.
Now with the 200 day MA broken, the sellers are making the next big play (kinda looks head and shoulder-esque). Stay below the 200 day MA keeps that idea intact.