Index is now down -0.92%
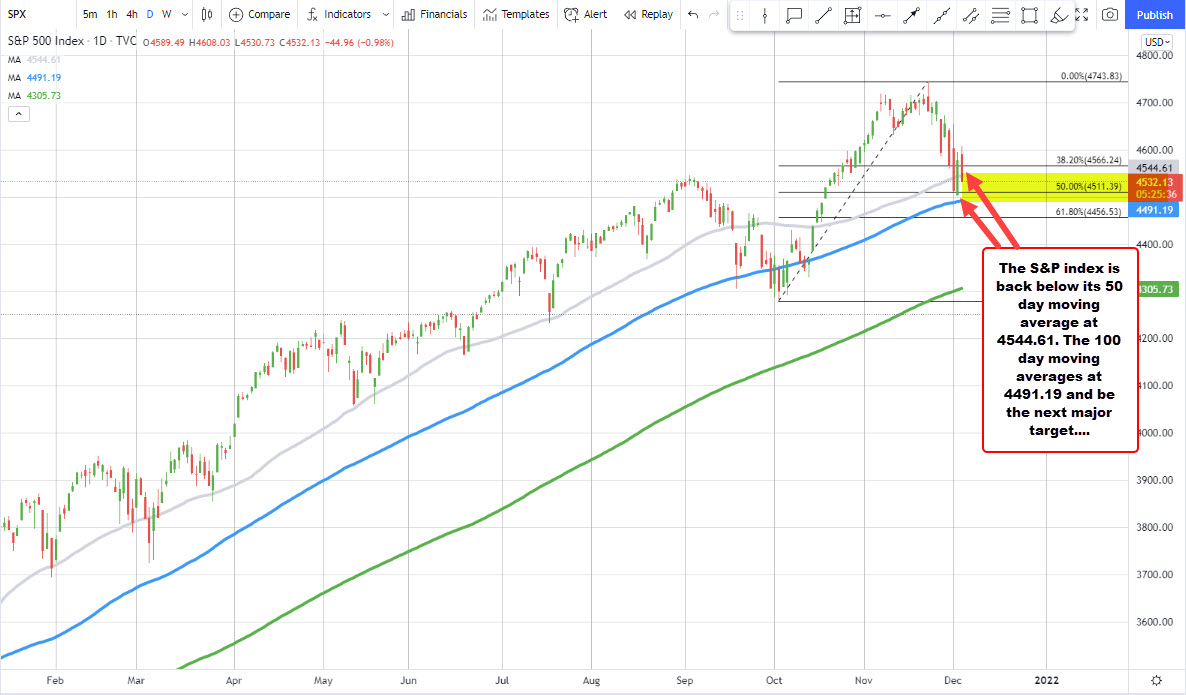
the S&P index has moved below its 50 day moving average at 4544.67. The current price trades at 4534.64. That’s down 42.2 points or -0.92%.
The index traded below the 50 day moving average both on Wednesday and Thursday but rallied after approaching the 100 day moving average of 4491.18 currently and finding dip buyers ahead of that key moving average. The price did move below the 100 day moving average back in September and again in October. A move below it would be more bearish from a technical perspective.
This article was originally published by Forexlive.com. Read the original article here.