Price also breaks above its 200 hour moving average
The USDCAD has shot higher on the back of tumbling oil prices (crude oil is trading below $70 at $69.39 currently). The pair also broke above some key resistance near the 1.2525 to 1.2527 area.
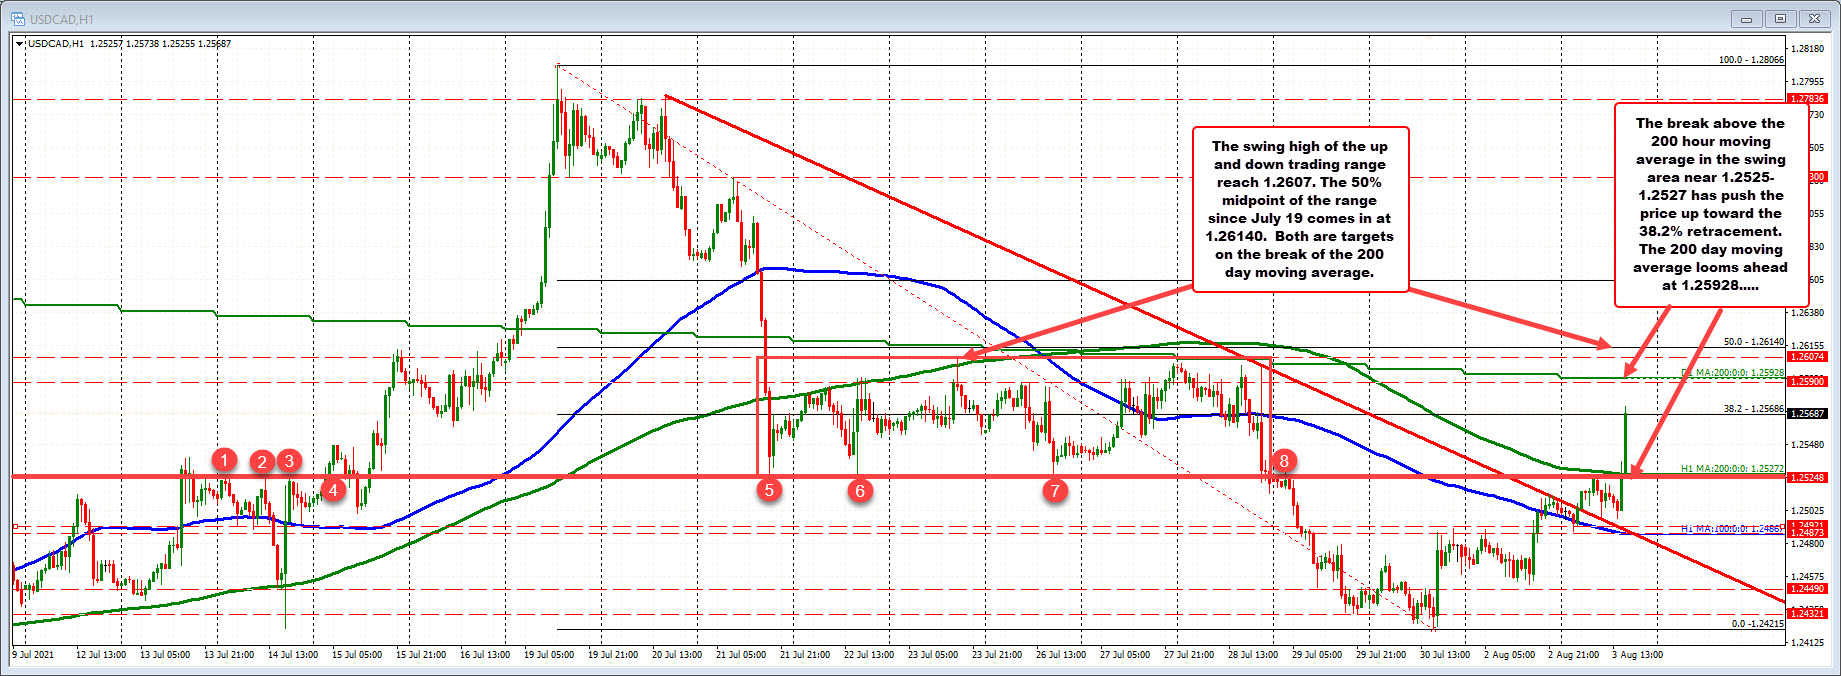
Looking at the hourly chart above, the falling 200 hour moving average comes in at 1.25272. Also looking back, there are a number of swing levels near that area going back to July 14 (see red numbered circles). The break above those levels, tilts the bias more to the upside and there has been a race higher in the price.
The pair has now moved just above the 38.2% retracement of the July trading range at 1.25686. The 200 day moving average looms above at 1.25928 currently. That is the next target.
Break above that target level, and traders will look toward the swing high from July 23 at 1.26074 along with the 50% midpoint of the range of the move down from the July 19 high. A level currently comes in at 1.2614.