NASDAQ test the 50 hour moving average. S&P test 100 hour moving average
The S&P and NASDAQ index moved to new session highs.
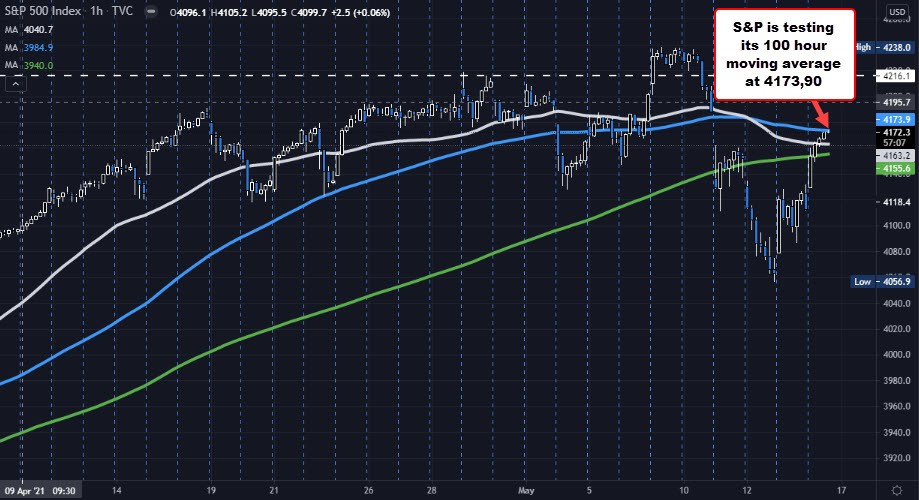
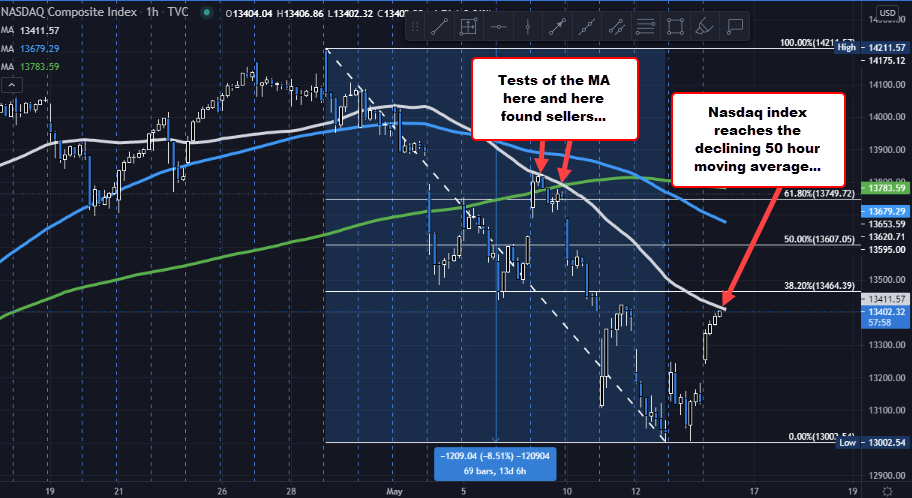
The S&P index reached 4173.43, while the NASDAQ index reached 13406.86.
At the highs, the indices were testing key hourly moving averages.
Looking at the S&P index, the 100 hour moving average comes in at 4173.90. The high price just reached 4173.43.
For the Nasdaq, its 50 hour moving average comes in at 13411.57. The high price just reached 13406.86.
This article was originally published by Forexlive.com. Read the original article here.