
- DXY extends the corrective downside to 92.85/80 band.
- Immediate contention is located at the 200-day SMA at 92.45.
The dollar extends the rejection from recent yearly highs near 93.50 and re-visits the 92.80 zone on Friday.
If the selling impulse gains further traction, then DXY could re-visit the key 200-day SMA in the mid-92.00s.
A convincing return to the area below the 200-day SMA should negate the ongoing near-term constructive stance.
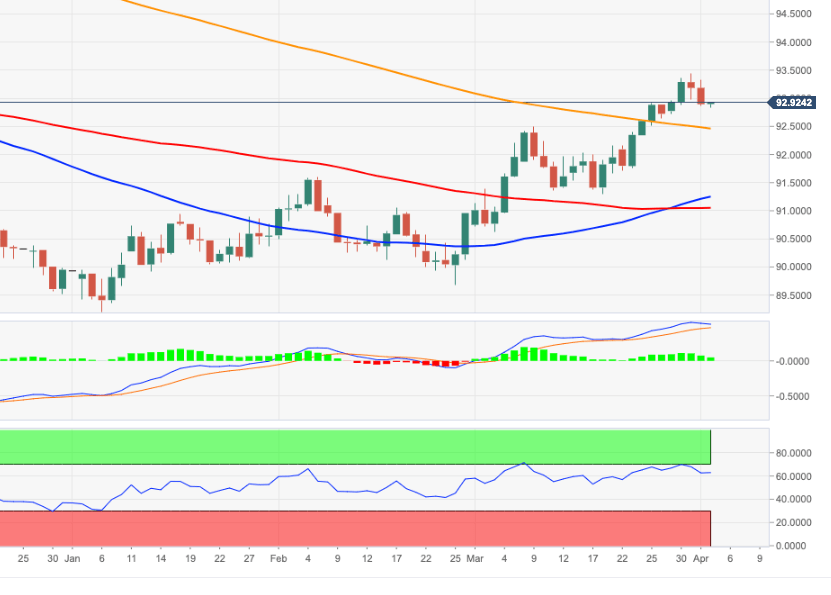
DXY daily chart
This article was originally published by Fxstreet.com. Read the original article here.