Swing area also being tested
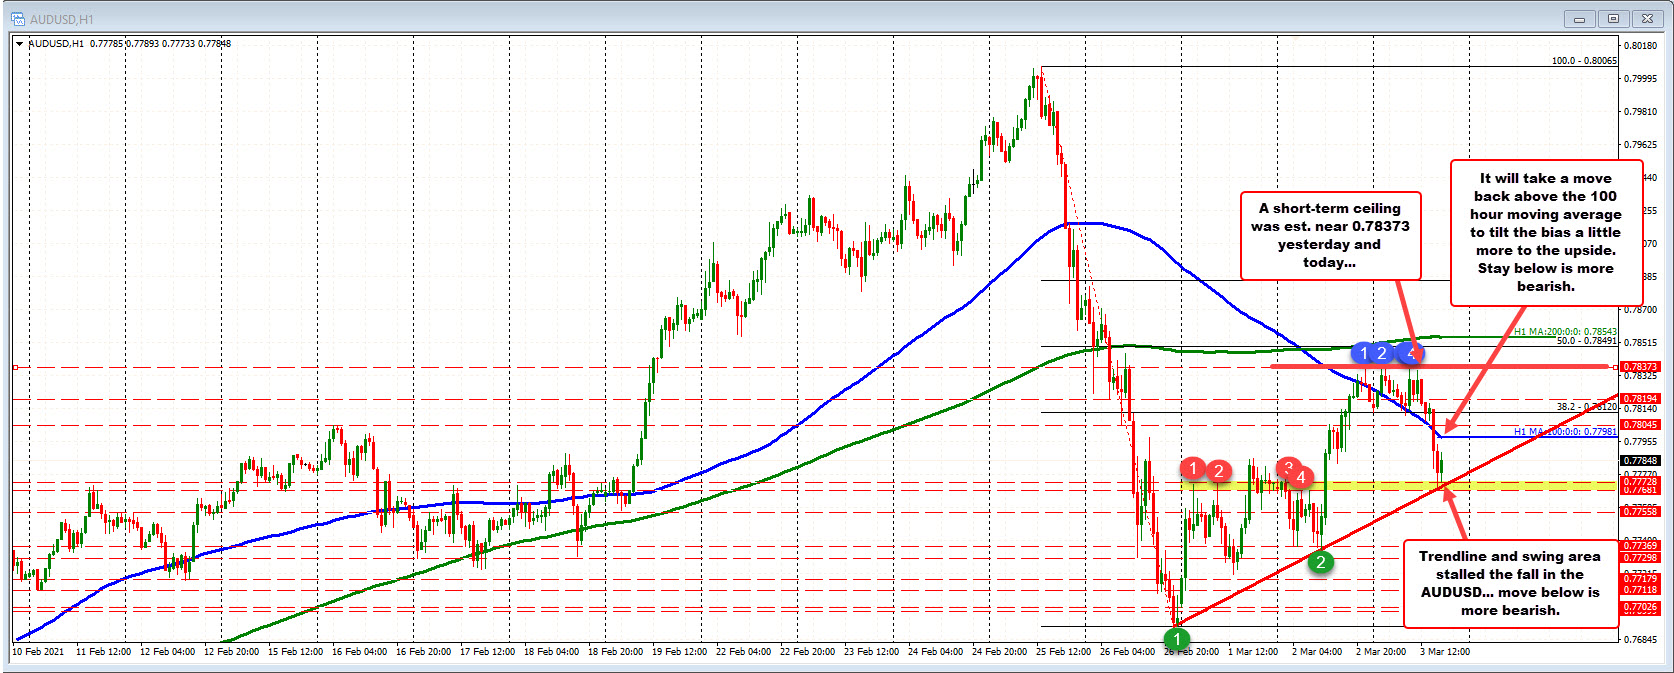
The AUDUSD is one of the weakest of the major currencies and in the process is testing a lower trendline on the hourly chart along with a swing area over the last few days between 0.7768 0.7772. A move below that area would be increase the bearish bias.
The move lower off the high ceiling near the 0.78373 level (see blue numbered circles) has now seen the price dipped below its 100 hour moving average at 0.77981 (blue line in the chart above). To takes back more control from the sellers, getting back above the 100 hour moving average would be needed. Above that and a break of the the 38.2% retracement at 0.7812 would have traders looking back toward the ceiling area at 0.78373. The 200 hour moving averages further higher at 0.78543.
On the downside, break below the trendline/swing area and traders will target 0.77558 followed by the lows from yesterday near 0.7736.