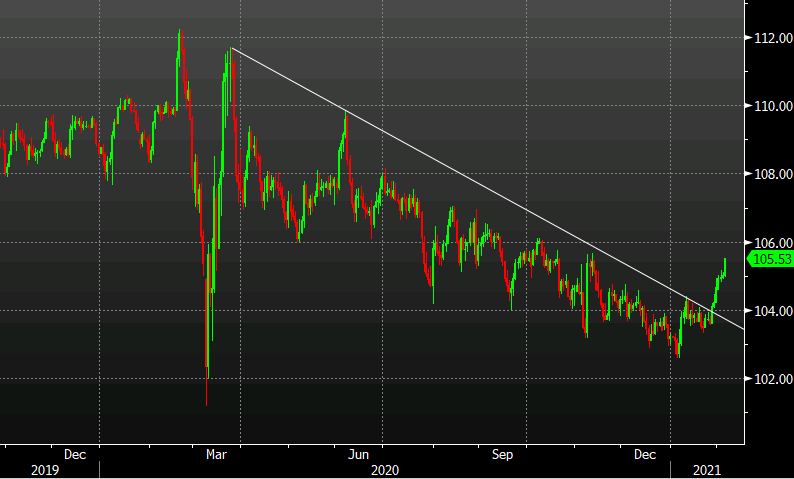
USD/JPY breaks the trend line and rallies for 7 days
This is a great chart for a Technical Analysis 101 class. Just draw a trendline and buy a break. USD/JPY is now up 7 days in a row.
It’s stalling ahead of the November highs so that’s a level to watch.
Beyond that, keep an eye on yields. There’s lot of talk about the move higher in US Treasury yields but 10s are flat today. Right now it’s a retracement, to make it into a sustainable move, we’ll need to see a sustained rise in yields.
This article was originally published by Forexlive.com. Read the original article here.