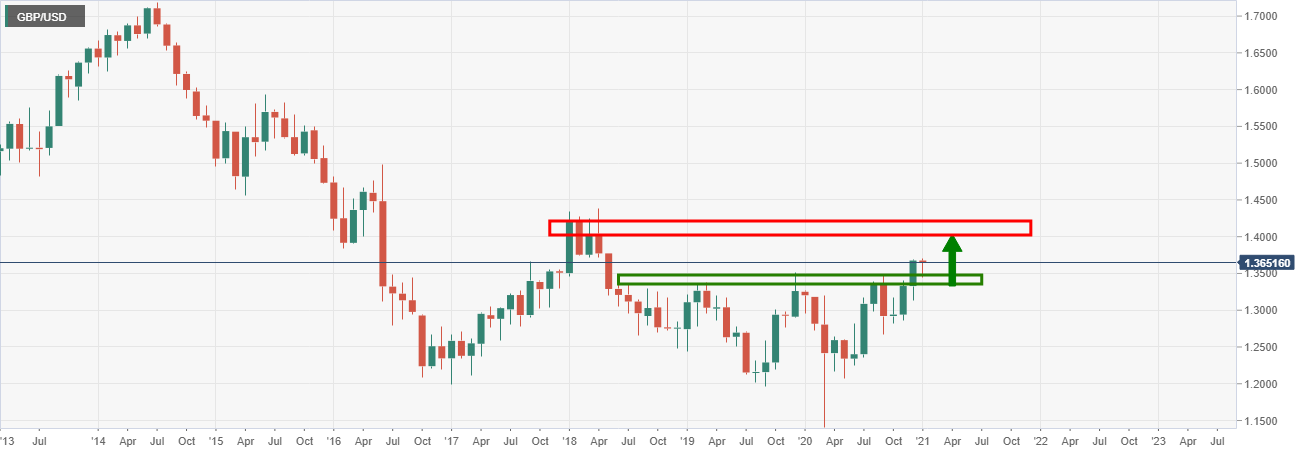
- GBP/USD bulls in the driver’s seat on a longterm analysis.
- The higher volume nodes are located in the 1.3820/30 area.
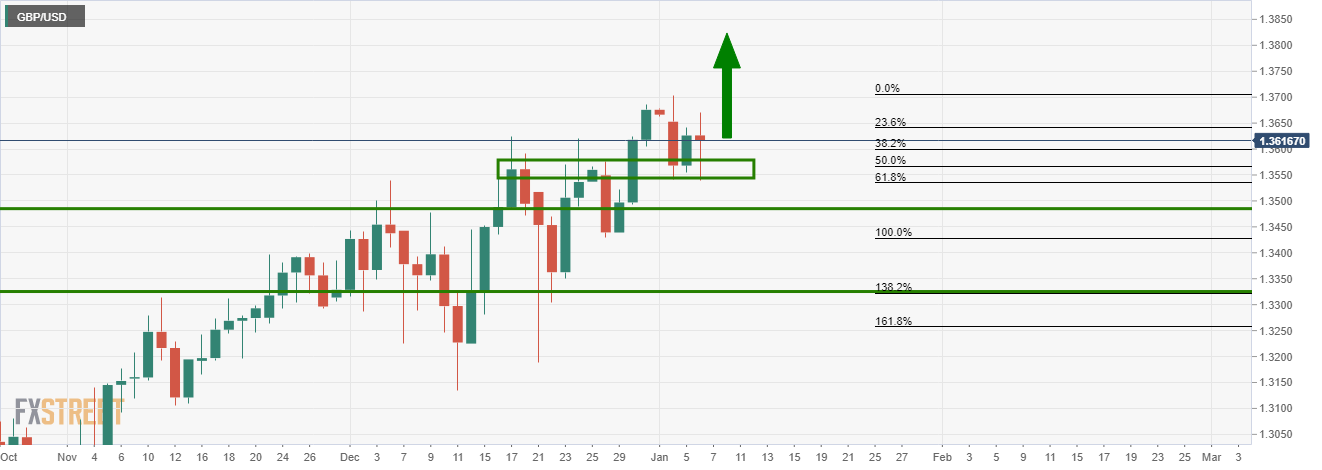
As per prior analysis at the start of the year, GBP/USD Price Analysis: Bulls seeking a 1.3750 daily extension, the pair has indeed forced its way to the target.
Prior analysis, monthly & daily charts
Live market
Low volume nodes point to a continuation
The move to the upside could be part of an even deeper move into resistance forecasted in the following analysis from back in December:
GBP Price Analysis: A a break of critical 1.3514 exposes low volume nodes to 1.3820
-637426285683417321.png)
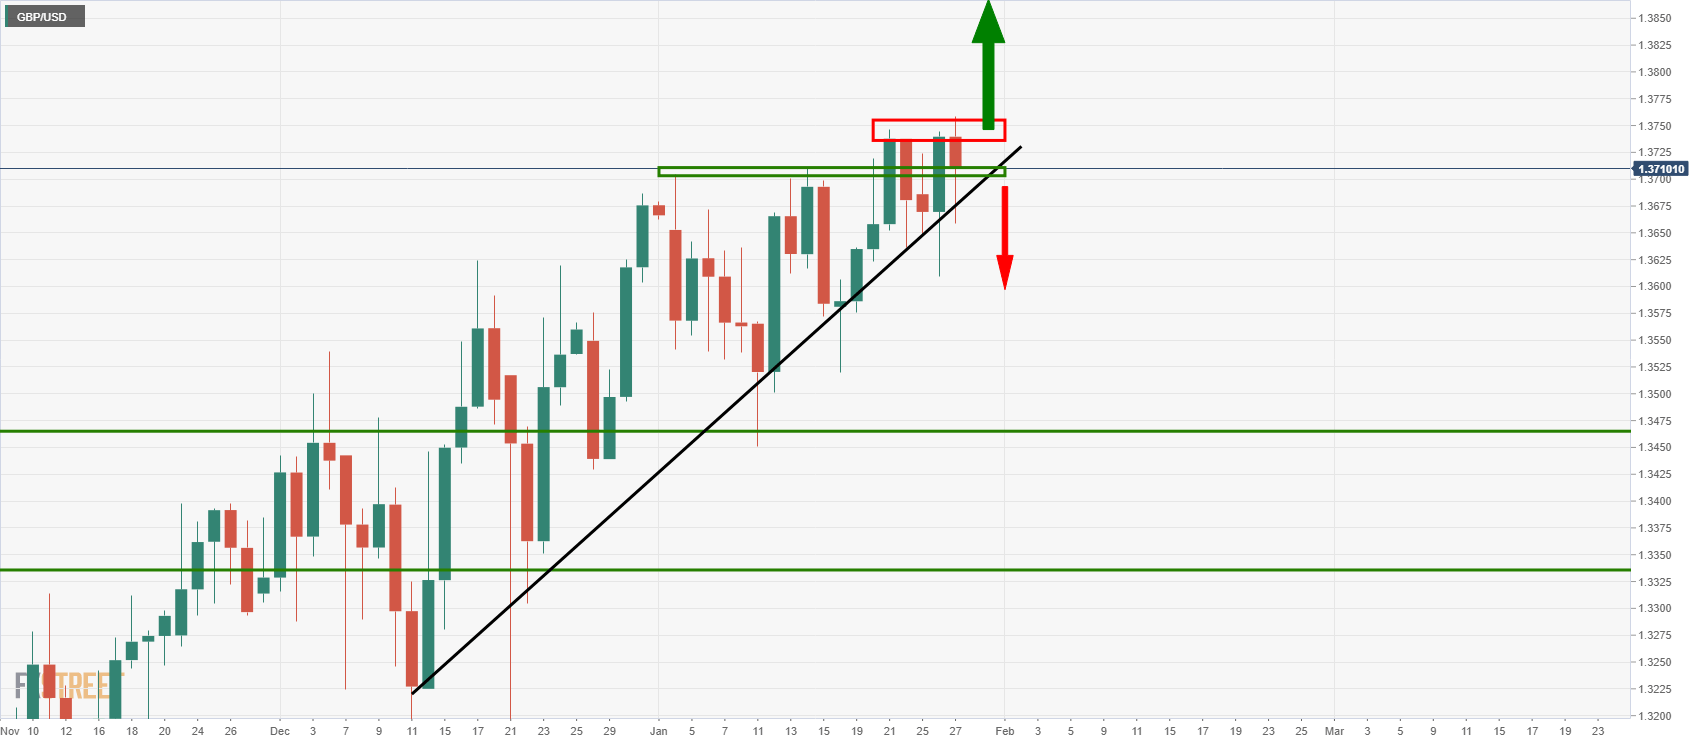
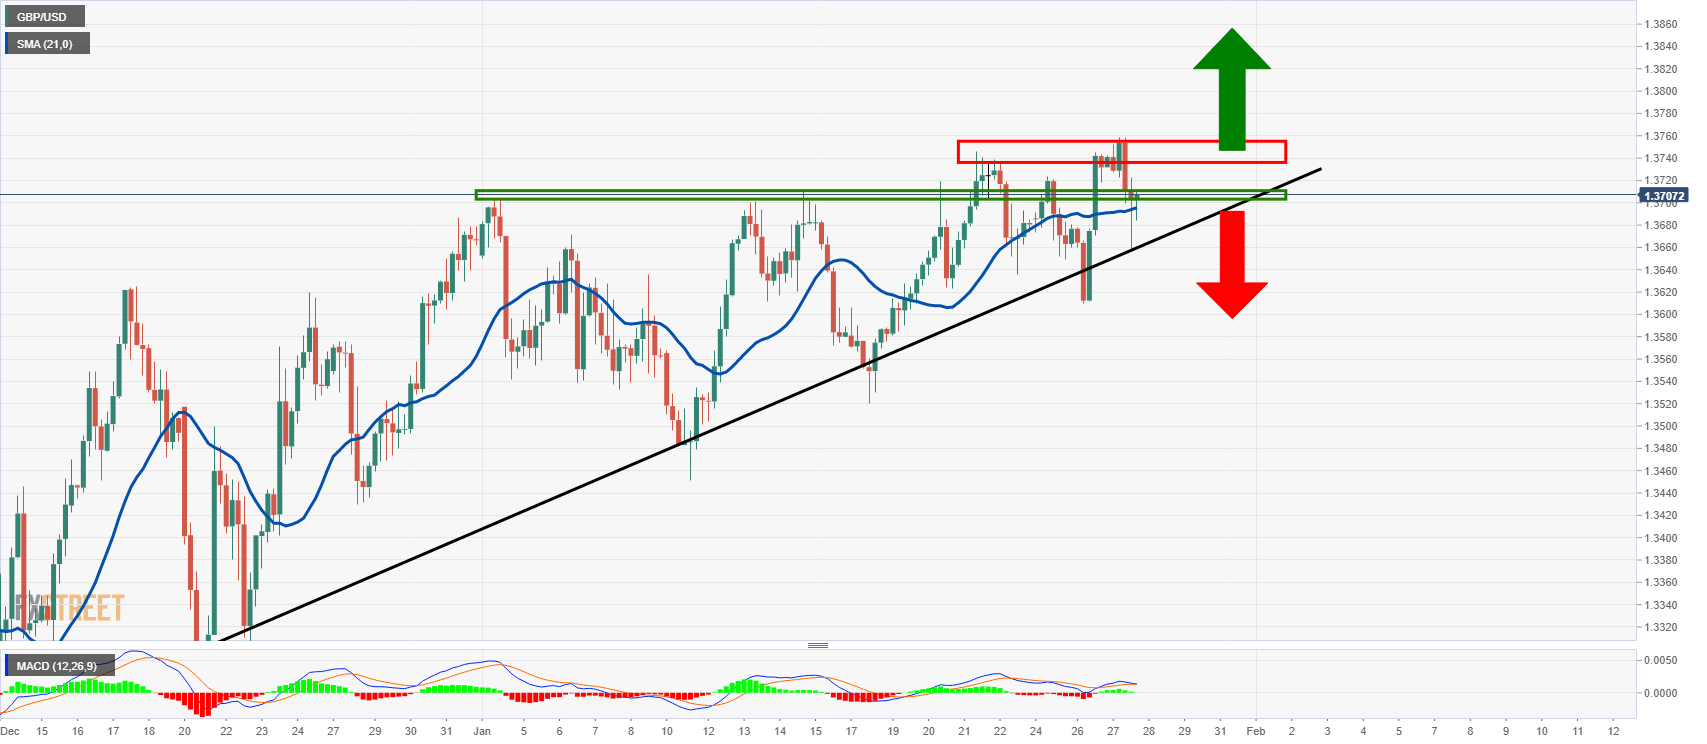
Current 4-hour chart
Meanwhile, the price is trapped, as displayed on the above daily chart, between key support and resistance while ascending along the dynamic trend line support.
The support is fortified by the 21 moving average and MACD is bullish while above zero which leaves an upside bias.
An upside continuation can target a -0.618% Fibonacci retracement level of the latest bullish impulse on the daily chart at 1.3833 as the pair progresses towards higher volume nodes.