2nd tested this week
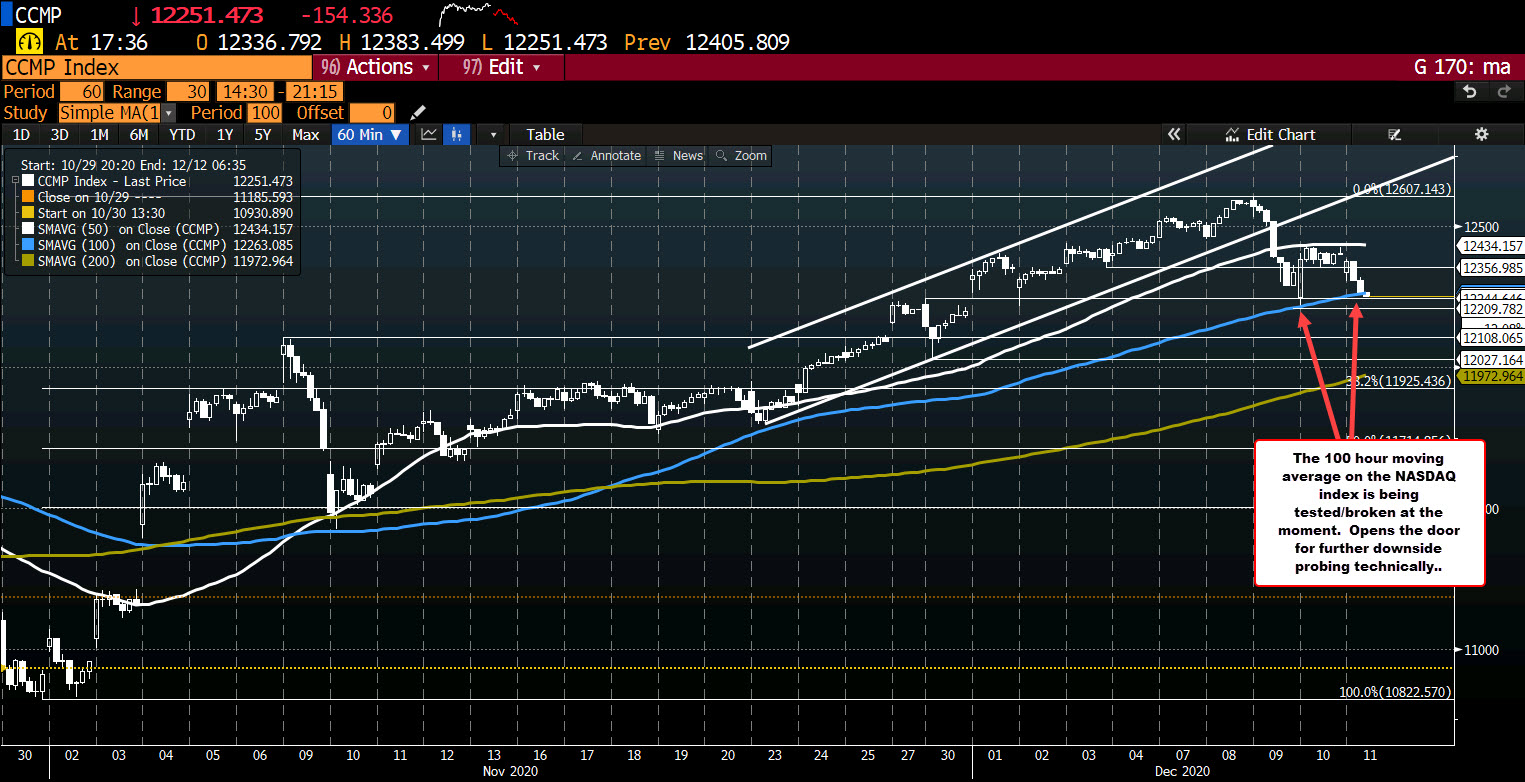
The NASDAQ index continues its run to the downside. It currently trades down -141 points at 12263.81. The low price reached 12257.069.
Technically looking at the hourly chart, the pair is testing its 100 hour moving average currently at 12263.18. The low on the last hourly bar dipped below the moving average but only by 1 or 2 points. Recall that yesterday, the price also tested the 100 hour moving average only to find buyers and bounced higher.
Key test for the index.
A move below and traders will start to target the low from yesterday at 12209.78. Below that would be the swing hi from November 9 at 12108.06 and the low from November 30 at 12027.164. The rising 200 hour moving average is down at 11972.97 (green line in the chart above).