- XAU/USD lost more than 1% last week and closed near $1,880.
- Bearish pressure could gather strength is gold drops below $1,860.
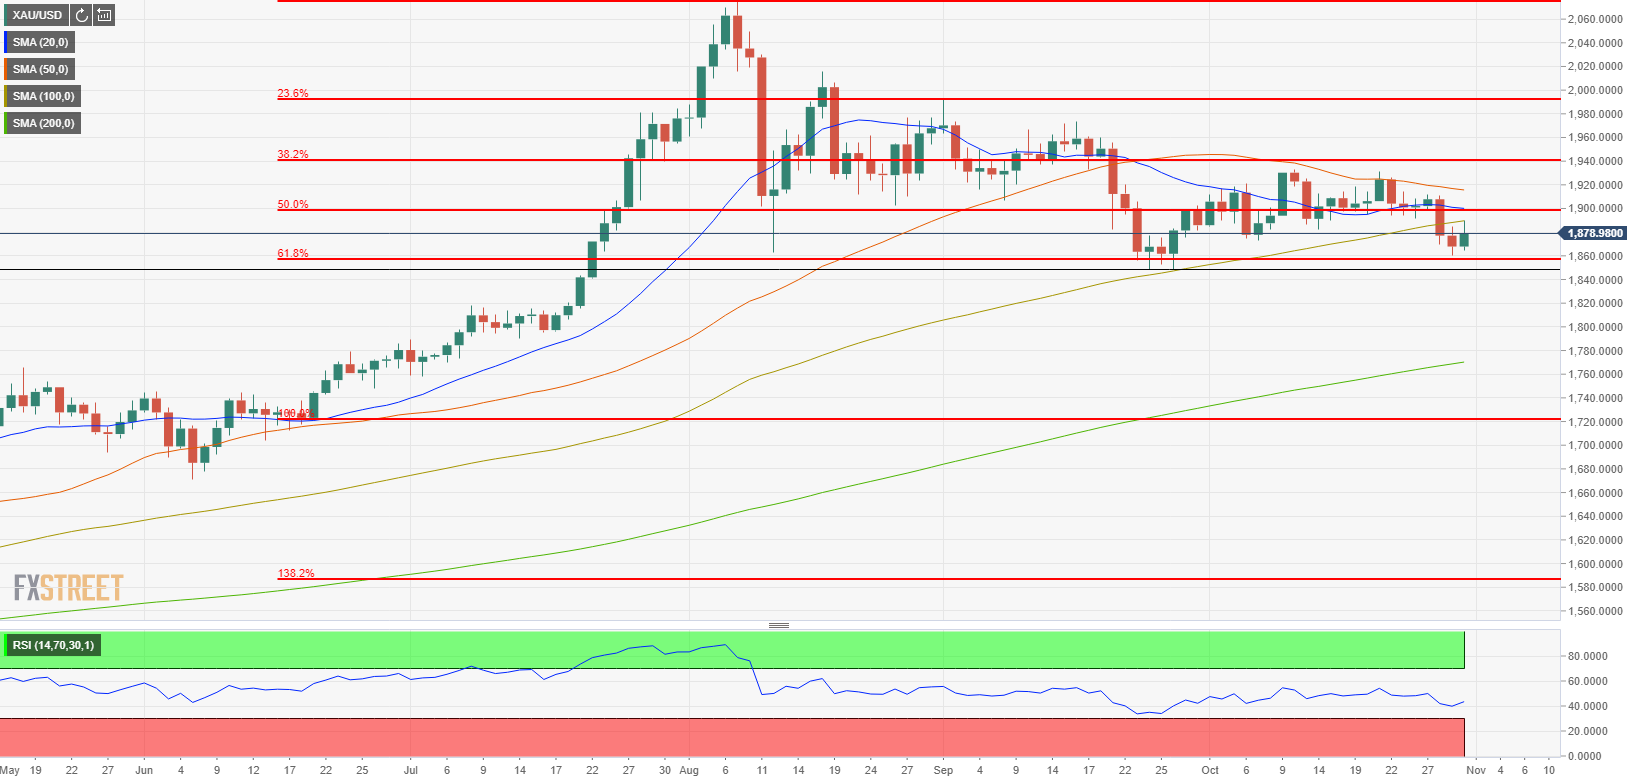
- 100-day SMA at $1,890 aligns as first resistance.
The XAU/USD pair suffered heavy losses on Wednesday and Thursday but staged a rebound on Friday. Despite the fact that the pair gained 0.6% on the last day of the week, it closed 1.2% lower on a weekly basis at $1,879.
XAU/USD technical outlook
On Thursday, gold touched its lowest level in a month at $1,860, where the Fibonacci 61.8% retracement of June-August rally is located. Although strong support seems to have formed around that level with the price turning north on Friday, the pair closed the third straight day below the 100-day SMA at $1,890. Unless XAU/USD successfully makes a daily close above $1,890, it is likely to retest $1,860. Below $1,860, $1,850 (September 24/26 low) could be seen as the next target.
On the upside, $1,890 (100-day SMA) is the initial hurdle ahead of $1,900 (psychological level/20-day SMA) and $1,916 (50-day SMA).
Gold daily chart