S&P index test the 50% retracement of the move down since September 2 high
The NASDAQ index and S&P index continue to push to the upside. The NASDAQ index is now up over 200 points or 1.86% at 11281.10 That is just off the high for the day.
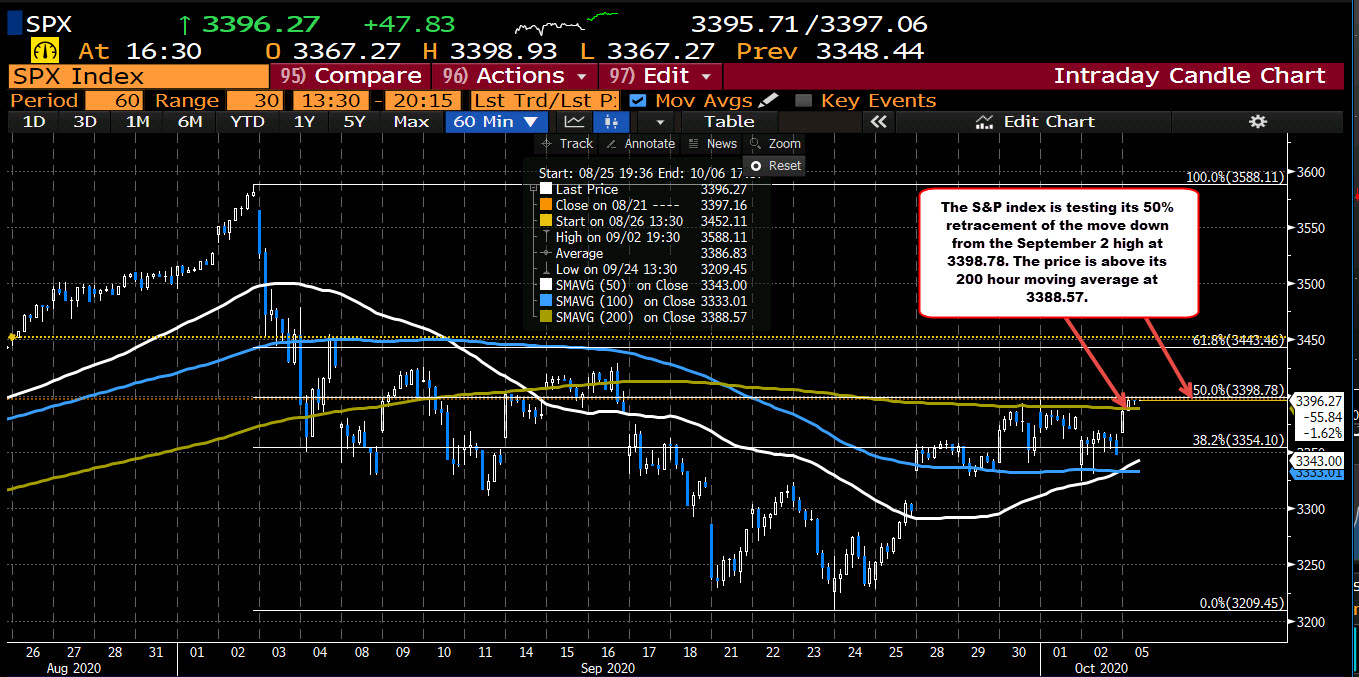
The S&P index (see chart above) is trading at 3396 up 47.62 points or 1.42%. The high price reached 3398.93.
Looking at the hourly chart below, the 50% of the move down from the September 2 high comes in at 3398.78. The high price today stalled just short of that level. The price is also ticking above its 200 hour moving average at 3388.57. Stay above is more bullish
This article was originally published by Forexlive.com. Read the original article here.