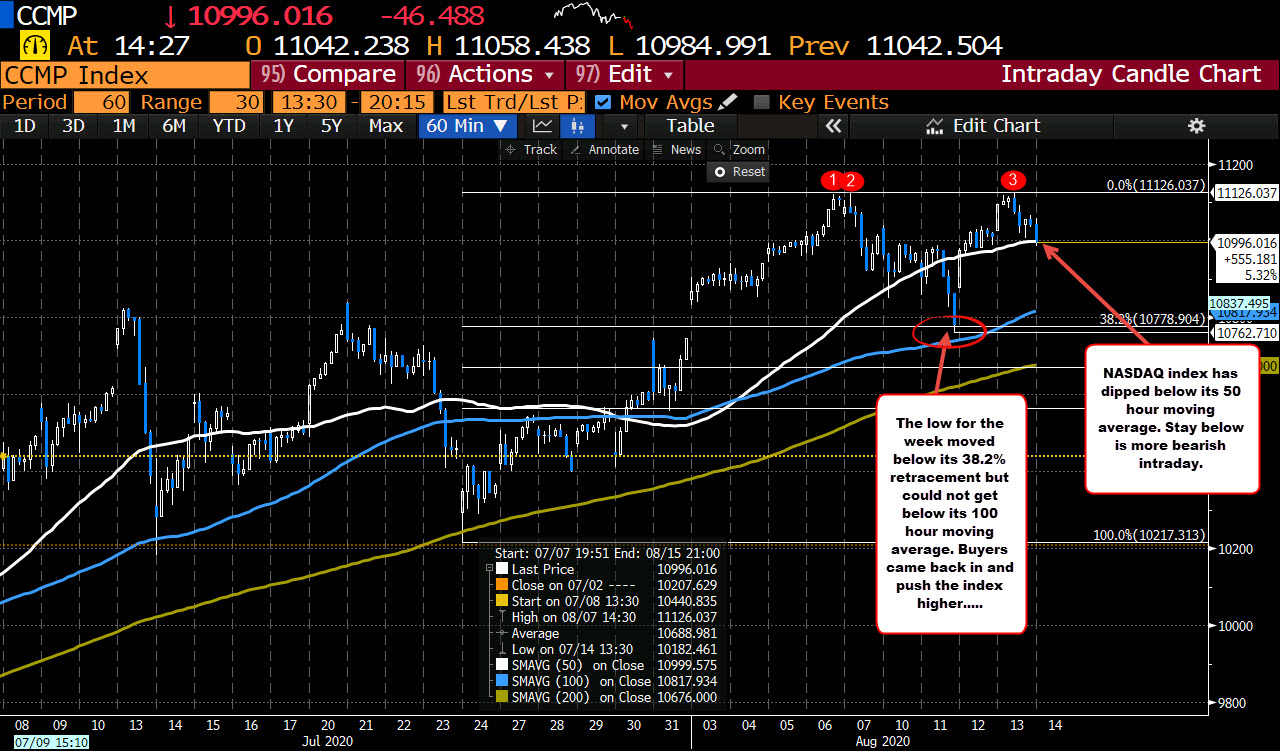
50 hour moving average at 10999.40.
The Nasdaq index has cracked below its 50 hour moving average near 11,000.
Looking at the hourly chart, the high from Monday reached 11126.037. The high price yesterday was just below that level at 11124 .85. The fall below the 50 hour moving averages a tilt to the downside from a technical perspective. If the price is able to stay below, there could be further downside probing.
For the week, the low was reached on Wednesday at 10762.71. The price fell below its 38.2% retracement of the move up from the July 24 low at 10778.904, but could not get below its got 100 hour moving average at 10737.55 (at the time). The 100 hour moving average currently comes in at 10817.976 (blue line in the chart above)
This article was originally published by Forexlive.com. Read the original article here.