- GBP/USD extends pullback from 1.2536 after flashing a bearish candlestick formation the previous day.
- Failures to cross 200-day EMA, lower high from the recent top favors the sellers.
- Bulls will have a bumpy road before challenging the June month top.
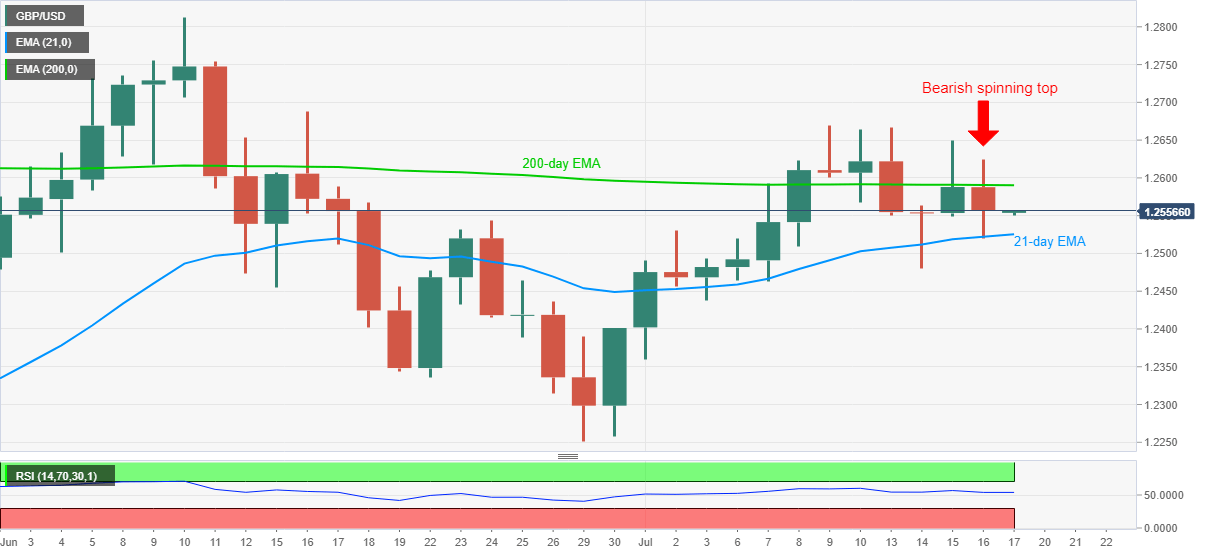
GBP/USD extends the latest recovery moves from 1.2536 to 1.2558 during the early Asian session on Friday. The Cable took a U-turn from 200-day EMA but couldn’t slip below 21-day EMA, which in turn portrayed a bearish spinning top on Thursday. The resulted formation gains support from the pair’s lower highs since July 09.
As a result, the sellers remain hopeful to attack the monthly low of 1.2480 1.2525, comprising 21-day EMA, followed by 1.2500, acting as immediate supports.
Should there be a clear downside past-1.2480, 1.2400 and 1.2350/45 can entertain the pessimists ahead of pushing them to June month’s low near 1.2250.
Alternatively, a daily close beyond 200-day EMA level of 1.2590 could renew attempts to refresh the monthly high of 1.2670. In doing so, 1.2625/30 can offer an intermediate halt during the rise.
GBP/USD daily chart
Trend: Bearish