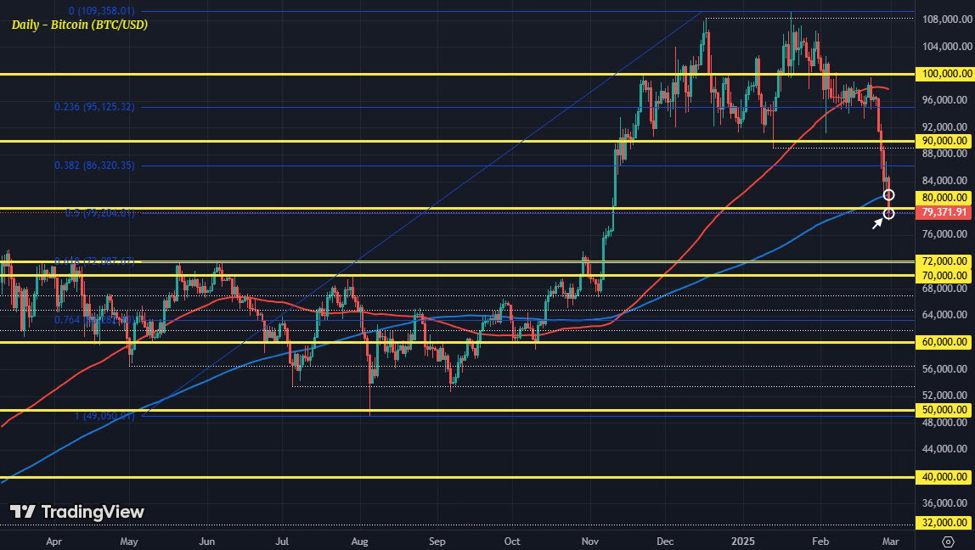
Bitcoin (BTC/USD) daily chart
The latest fall today now sees price fall by over 27% from the highs at the start of the year. We’ve pretty much halved the advance since the start of October and the Fib retracement above reinforces the pullback momentum. We’re now running into the 50.0 Fib retracement level of the swing higher since August-October to January. However, perhaps more importantly is that we’re seeing price break below the 200-day moving average (blue line) today.
The break of the 100-day moving average (red line) and $90,000 mark set off a heavy wave of selling in the past week. And that’s culminating with yet another key technical break now as noted above.
That’s an alarming sign as it only serves to reinforce the selling momentum. The 50.0 Fib retracement level at $79,204 might offer something to work with but we might be staring at a steeper drop towards $70,000 next for Bitcoin as the worries grow.
It’s been a tough week for risk assets in general with the dollar also keeping firmer overall. But in the case of Bitcoin, it is also suffering from some added spillover pain from Ethereum – which experienced a bit of a fallout from the whole ByBit hacking drama.
In any case, we’re approaching some cautious and alarming levels on the chart as seen above. And that’s something worth taking notice as it could lead to an even stronger pullback in crypto pricing.
The silver lining for Bitcoin is that some dips that follow the pattern above don’t quite adhere to the traditional asset class narrative; albeit with a very small sample size.
The fall from $70,000 to $50,000 last year was one example, before some consolidation then break to fresh record highs in November. Then, there was also the fall from $60,000 to $30,000 in 2021, where price quickly rebounded back to $68,000 after.
That being said, the latter was also a lesson to be heeded as price subsequently turned lower in 2022 in a fall to $18,000. So, while there are some positive experiences for dip buyers, it’s not necessarily a given.
The upshot here is to read the tea leaves and play the odds accordingly. The technical signs are troubling for Bitcoin and the fallout here comes alongside some selling in broader markets too i.e. US stocks and gold. That’s something to be wary about as we run the risk of a sharper correction across the board.