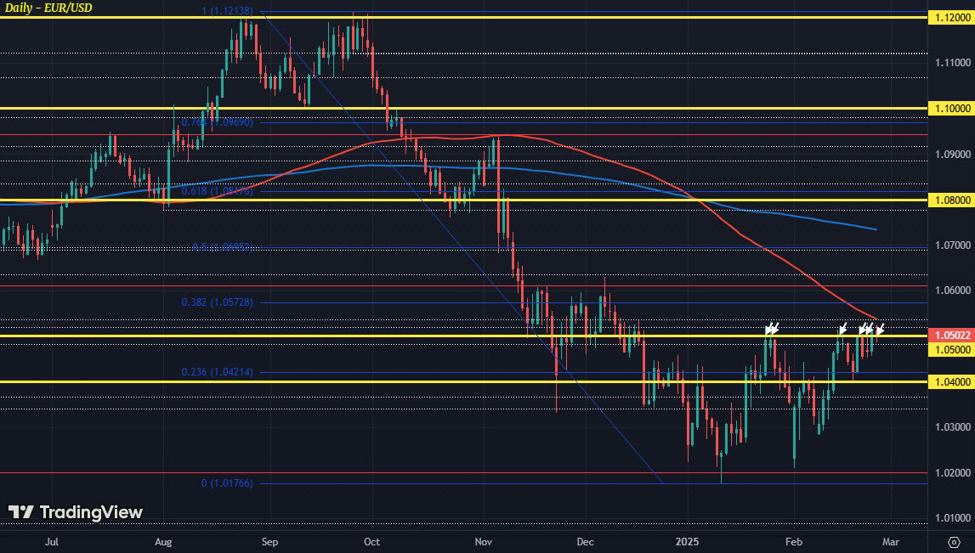
EUR/USD daily chart
EUR/USD continues to knock on the door of the 1.0500 level this week. A weaker dollar after the softer US consumer confidence data yesterday helped to underpin the pair but I wouldn’t say buyers have done enough just yet. The close yesterday was at 1.0512 but it’s not all too convincing of a breakout for now.
As mentioned earlier in the week, the 100-day moving average (red line) – now seen at 1.0537 – remains another key technical level to watch in all this.
It means buyers have very little breathing room on clearing the 1.0500 mark. They will have to also break above the 100-day moving average at the same time, to really convince of a stronger push higher from here.
There won’t be much catalysts today, so it’ll be more about the ebb and flow of things.
The larger option expiries in the pair dictates that we should see price action contained below the 1.0500-30 region before getting to US trading. Later on, risk flows will be one to watch with month-end flows also a major consideration over the next two to three days too.
With the latter being one of the more difficult ones to eyeball, the technicals are always the best in helping with that. And that brings us to the key levels seen in the chart above in identifying what to look out for in terms of the bias for EUR/USD this week.