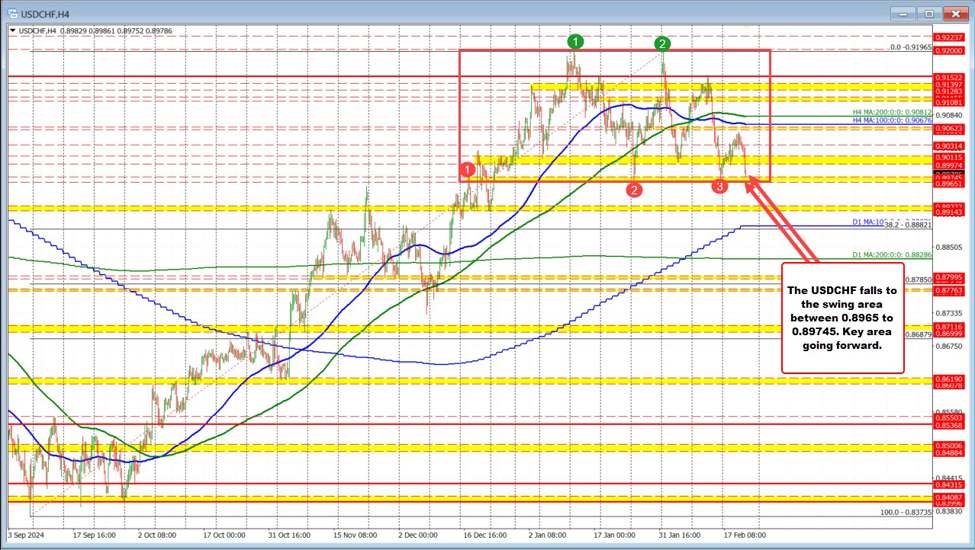
As the trading day nears its close, USDCHF is testing the lower boundary of its multi-week trading range, which has been in place since mid-December. On the 4-hour chart, the pair formed a double top at the January high two weeks ago before reversing lower. Last week, the price found buyers at range support (0.8965 – 0.8975) and rebounded, reaching a high of 0.9054 yesterday before turning lower again.
Today’s broad USD weakness has pushed USDCHF back to the upper boundary of the lower swing area (0.8965 – 0.8975), with the latest low touching 0.8975. This level now acts as a critical barometer for buyers and sellers heading into the next session.
Key Technical Levels:
-
Support:
- 0.8965 (break below here could open the door for further downside)
- 0.8914 – 0.8927 (next key support zone)
- 0.8882 (38.2% retracement of the December-February rally)
- 0.8800 (100-day moving average)
-
Resistance:
- 0.8997 – 0.9011 (higher swing area, reclaiming this would signal a continuation of the range-bound pattern)
- 0.9054 (recent high, a break above strengthens bullish momentum)
A break below 0.8965 could accelerate downside momentum toward 0.8914 – 0.8927. However, if buyers defend this support, a rebound toward 0.8997 – 0.9011 would reinforce the ongoing range-bound price action that has defined USDCHF over the past two months.
