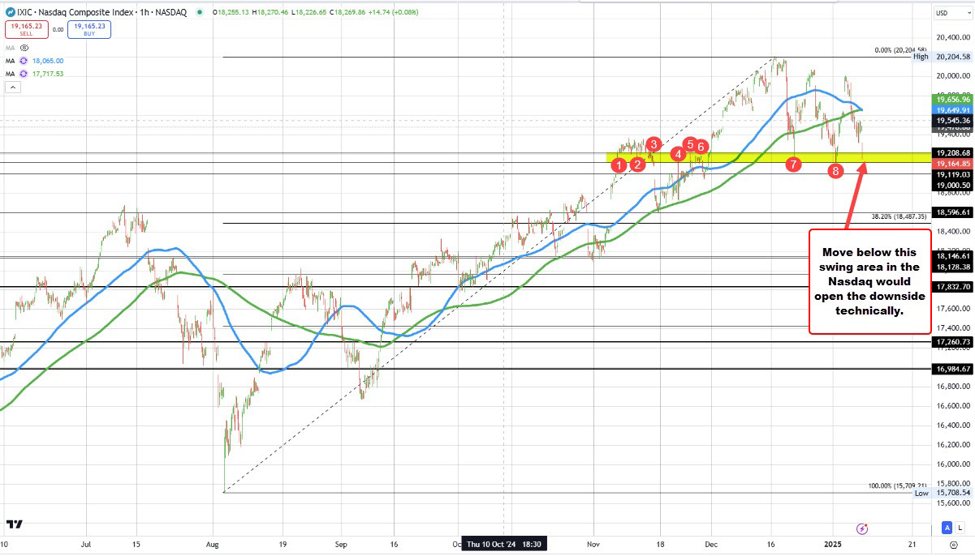
The NASDAQ index moved to a low of 19143.64. That was down over 300 points on the day and in the process has moved within a swing area defined by recent swing lows of swing highs between 19119 and 19208 . A move below that area would open the door for further selling technically (see renumbered circles on the chart above).
The University of Michigan sentiment index came in a little weaker than expected but the one-year inflation expectations rose to 3.3% from 2.9% last month. The five-year inflation also ticked higher to 3.3% from 3.1%.
That scared has the NASDAQ Dow down -378 points or -1.99% at 19091. That is breaking below the low of the aforementioned swing area.
10 year yield is higher but let at its highest level. It currently is trading at 4.763% up 8.2 basis points. The two year yield is up nine basis points at 4.351%
