Fundamental
Overview
The S&P 500 managed to
extend the rally into a new all-time high recently. The conditions for further
upside in the index remain in place.
In fact, Trump’s policies will
be a positive driver for growth in 2025 and with the Fed remaining in an easing
cycle, growth should remain positive and might even accelerate as signalled
already by the Atlanta Fed GDPNow indicator.
The only bearish reason we
had for the stock market was the rise in Treasury yields in the past couple of
months. That’s generally bearish only when the Fed is tightening policy though
not when yields rise on positive growth expectations.
Right now, the Fed’s
reaction function is that a strong economy would warrant an earlier pause in
the easing cycle and not a tightening. That should still be supportive for the
stock market.
If the Fed’s reaction
function were to change to a potential tightening, then that will likely
trigger a big correction in the stock market on expected economic slowdown. For
now, the pullbacks look as something healthy and opportunities to buy the dips.
S&P 500
Technical Analysis – Daily Timeframe
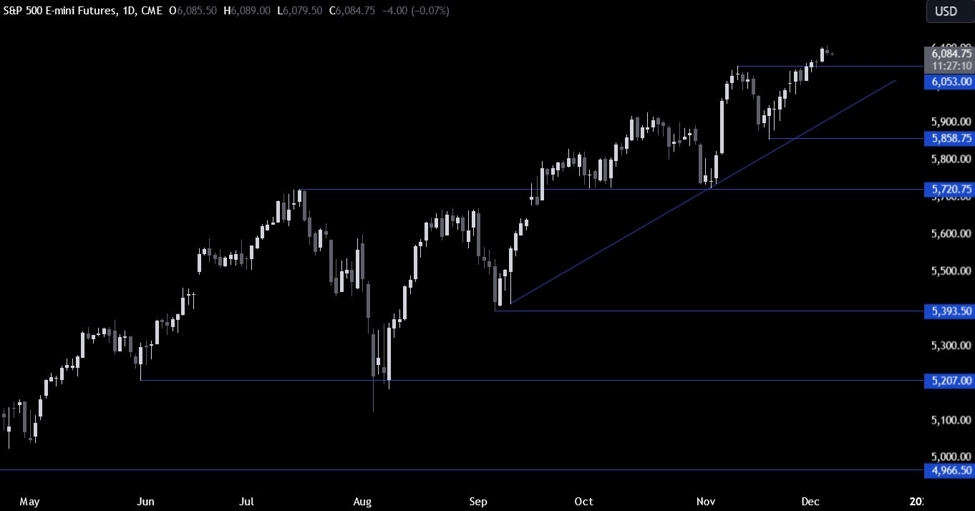
S&P 500 Daily
On the daily chart, we can
see that the S&P 500 extended the rally into a new all-time high recently
and it’s now pulling back from the highs. The buyers will likely step in around
the previous all-time high at 6053 to position for further upside. The sellers,
on the other hand, will want to see the price breaking lower to increase the bearish
bets into the trendline
around the 5900 level.
S&P 500 Technical
Analysis – 4 hour Timeframe
S&P 500 4 hour
On the 4 hour chart, we can
see that we have a minor upward trendline defining the current bullish momentum.
The buyers will likely keep on leaning on it to position for new highs, while
the sellers will look for a break lower to increase the bearish bets into the 6053
level.
S&P 500 Technical
Analysis – 1 hour Timeframe
S&P 500 1 hour
On the 1 hour chart, we can
see that we have an interesting zone around the 6090 level where the price
reacted from several times in the past few days. The sellers will likely step
in there to position for the break below the trendline, while the buyers will
look for a break higher to increase the bullish bets into a new all-time high. The
red lines define the average daily range for today.
Upcoming
Catalysts
Today we conclude the week with the US NFP report.
