- The Japanese Yen is seen oscillating in a narrow trading band against the US Dollar on Friday.
- A softer risk tone, trade war fears, and geopolitical risks underpin benefit the safe-haven JPY.
- The USD/JPY bears seem reluctant to place aggressive bets ahead of the key US NFP report.
The Japanese Yen (JPY) struggles to capitalize on the previous day’s modest gains and oscillates in a narrow range against its American counterpart during the early European session on Friday. The near-term bias, meanwhile, seems tilted in favor of the JPY bulls amid the Bank of Japan’s (BoJ) more hawkish stance. In fact, the BoJ remains on track for more interest rate hikes, while other major central banks, including the US Federal Reserve (Fed), are seen lowering borrowing costs further.
Apart from this, the recent decline in the US Treasury bond yields and a slight deterioration in the global risk sentiment seem to underpin the safe-haven JPY. This, along with subdued US Dollar (USD) price action, keeps the USD/JPY pair on the defensive near the 150.00 psychological mark ahead of the US Nonfarm Payrolls (NFP) report. The crucial data could offer fresh cues about the Fed’s rate-cut path, which, in turn, will drive the USD and influence the currency pair in the near term.
Japanese Yen traders remain on the sidelines ahead of US NFP report; bullish bias remains
- The Japanese Yen struggles to gain any meaningful traction as traders look to find out whether the Bank of Japan will deliver another interest rate hike at its upcoming monetary policy meeting later this month.
- BoJ Governor Kazuo Ueda said last week that rate hikes are nearing in the sense that economic data are on track. BoJ’s Toyoaki Nakamura said on Thursday that the central bank must move cautiously in raising rates.
- Russia has pounded Ukraine with long-range weapons and sustained ground assaults in the country’s east during the past week and has shown little sign of fatigue in the conflict, which has been raging for nearly two years.
- Adding to this, concerns that US President Donald Trump’s trade tariff could trigger the second wave of global trade wars temper investors’ appetite for riskier assets and offer some support to the safe-haven JPY.
- According to the CME Group’s FedWatch Tool, the markets are pricing in a 70% chance that the Federal Reserve will lower borrowing costs by 25 basis points at the December meeting and a 30% probability of a pause.
- Rate cut bets held broadly steady after the US Department of Labor (DoL) reported on Thursday that Initial Jobless Claims rose to 224K for the week ended November 29, from the previous week’s upwardly revised 215K print.
- The yield on the benchmark 10-year US government bond languishes near its lowest level since October 22 and further benefits the lower-yielding JPY, though a modest US Dollar uptick lends support to the USD/JPY pair.
- The market attention remains glued to the US Nonfarm Payrolls (NFP) report, which will guide Fed policymakers on their next policy decision. This, in turn, will influence the USD and provide a fresh impetus to the currency pair.
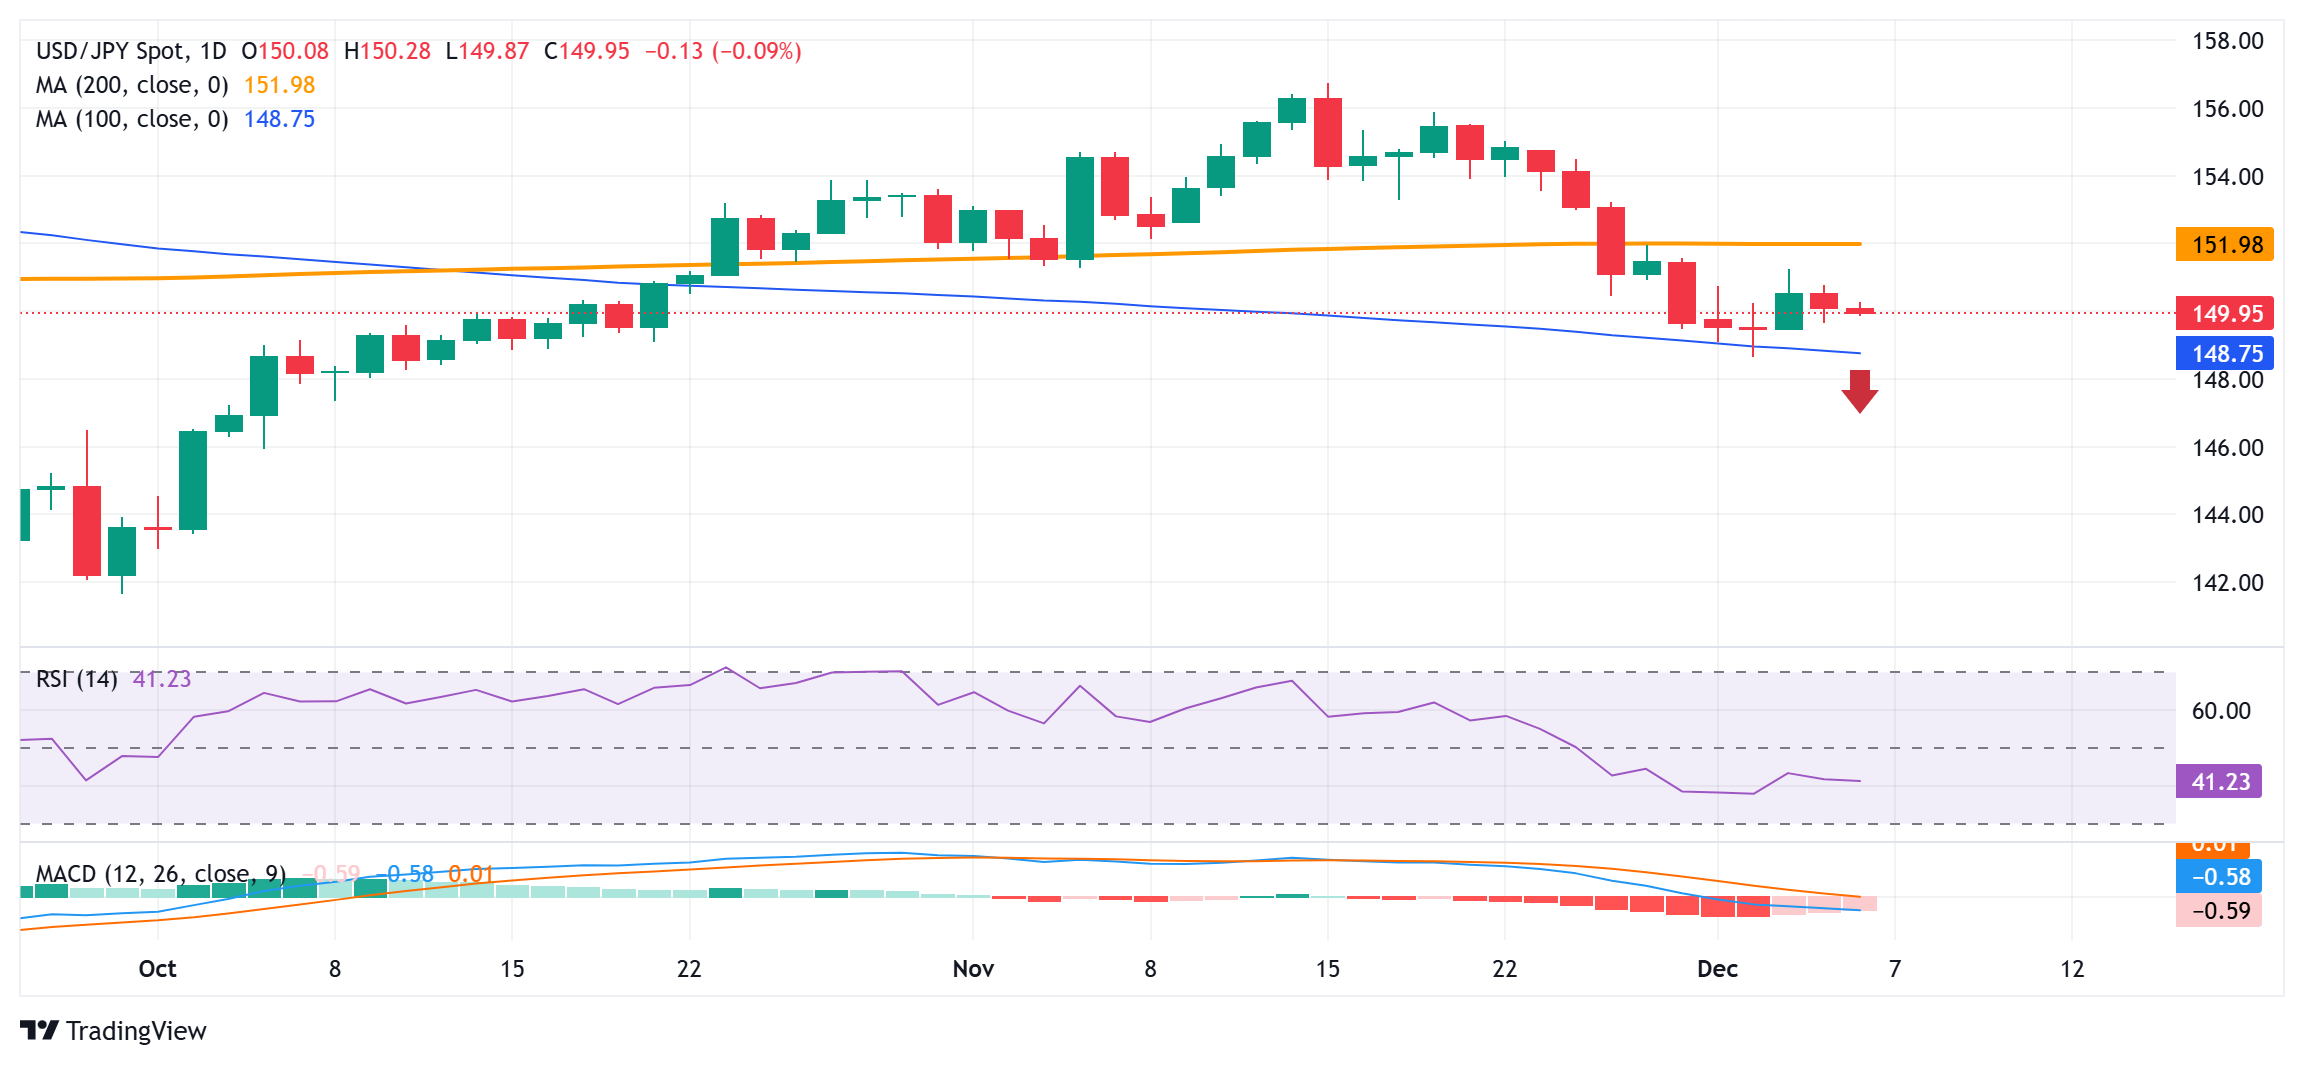
USD/JPY needs to break below the 100-day SMA pivotal support for bears to seize control
From a technical perspective, the overnight swing low, around the 148.65 region, now seems to protect the immediate downside ahead of the 149.00 mark and the 100-day SMA, currently around the 148.80 region. The latter should act as a key pivotal point, which if broken decisively will be seen as a fresh trigger for bearish traders. Given that oscillators on the daily chart are holding in negative territory, the USD/JPY pair might then slide to the 148.10-148.00 region en route to the 147.35-147.30 zone and the 147.00 round figure.
On the flip side, attempted recovery might now confront some resistance near the 150.55 region. This is followed by the 150.70 hurdle, the 151.00 round figure and the weekly high, around the 151.20-151.25 zone touched on Wednesday. A sustained move beyond the latter could lift the USD/JPY pair to the 152.00 mark, or the very important 200-day SMA. Some follow-through buying will suggest that the recent corrective decline from a multi-month high touched in November has run its course and shift the bias in favor of bullish traders.
Japanese Yen PRICE Last 30 days
The table below shows the percentage change of Japanese Yen (JPY) against listed major currencies last 30 days. Japanese Yen was the strongest against the Australian Dollar.
| USD | EUR | GBP | JPY | CAD | AUD | NZD | CHF | |
|---|---|---|---|---|---|---|---|---|
| USD | 3.34% | 2.19% | -0.92% | 1.47% | 3.29% | 2.34% | 1.87% | |
| EUR | -3.34% | -1.12% | -4.17% | -1.79% | -0.05% | -0.97% | -1.43% | |
| GBP | -2.19% | 1.12% | -3.12% | -0.72% | 1.07% | 0.13% | -0.31% | |
| JPY | 0.92% | 4.17% | 3.12% | 2.47% | 4.32% | 3.34% | 2.90% | |
| CAD | -1.47% | 1.79% | 0.72% | -2.47% | 1.81% | 0.86% | 0.41% | |
| AUD | -3.29% | 0.05% | -1.07% | -4.32% | -1.81% | -0.93% | -1.38% | |
| NZD | -2.34% | 0.97% | -0.13% | -3.34% | -0.86% | 0.93% | -0.44% | |
| CHF | -1.87% | 1.43% | 0.31% | -2.90% | -0.41% | 1.38% | 0.44% |
The heat map shows percentage changes of major currencies against each other. The base currency is picked from the left column, while the quote currency is picked from the top row. For example, if you pick the Japanese Yen from the left column and move along the horizontal line to the US Dollar, the percentage change displayed in the box will represent JPY (base)/USD (quote).

