Fundamental
Overview
The US Dollar continues to
consolidate around the highs as the market reached the peak in the repricing of
interest rates expectations and it will need stronger reasons to price out the
remaining rate cuts for 2025.
This was signalled by the
lack of US Dollar strength after lots of strong US data with the market’s
pricing remaining largely unchanged around three rate cuts by the end of 2025.
We might see the greenback remaining on the backfoot at least until the US CPI
due next week.
On Monday, Fed’s Waller and Fed’s Williams sounded like a rate cut in December
is basically a done deal with the plan to slow the pace of rate cuts
considerably in 2025. That’s in line with the market’s pricing.
We will likely need another
hot CPI report to force them to skip the December cut. In case the data comes
out as expected or even misses forecasts, then we can expect more USD weakness.
On the CAD side, we had the
Canadian CPI recently and the data came in
stronger than expected. This decreased the chances of a 50 bps cut in December
with the market now seeing a 40% chance for such a move. As a reminder, the BoC
is now focused on growth as they met their inflation target.
Tomorrow, we get the Canadian
labour market report alongside the US NFP. Better than expected data should see
the probabilities for a 25 bps cut increasing and give the CAD some support, especially
if the US NFP doesn’t come out too strong. On the contrary, weaker than
expected figures could weigh on the CAD but we might not see a new cycle high
if the USD remains weak.
USDCAD
Technical Analysis – Daily Timeframe
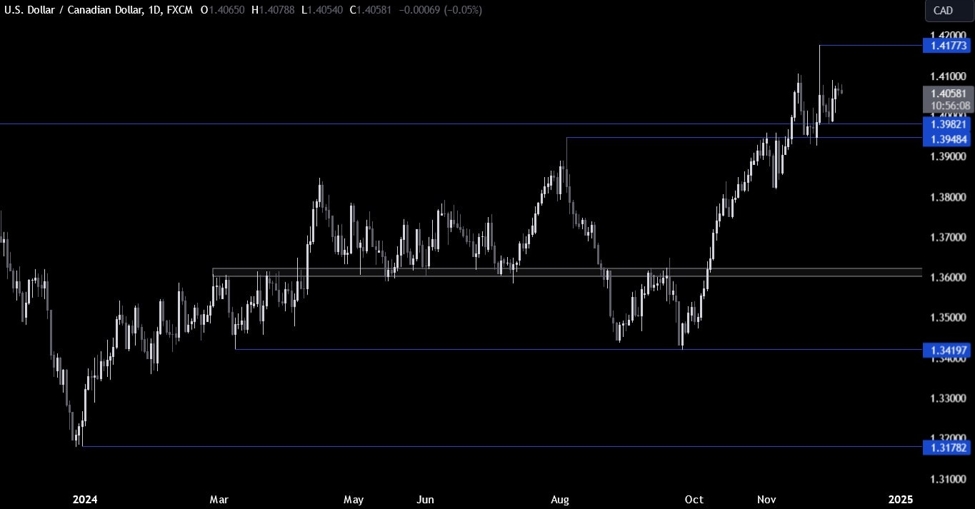
USDCAD Daily
On the daily chart, we can
see that USDCAD is consolidating around the highs after the brief spike on the
Trump’s tariffs threat. The market is still waiting for the US NFP and the US
CPI before picking a direction, so there’s not much to see here. The sellers
will need the price to fall below the 1.3950 level though to start targeting
new lows as such a break should switch the bias from bullish to bearish.
USDCAD Technical
Analysis – 4 hour Timeframe
USDCAD 4 hour
On the 4 hour chart, we can
see that we have a trendline
defining the current bullish momentum on this timeframe. If we get a pullback
into it, we can expect the buyers to lean on the trendline to position for a
rally into a new cycle high. The sellers, on the other hand, will want to see a
break below the trendline and the 1.3950 support
to start targeting new lows.
USDCAD Technical
Analysis – 1 hour Timeframe
USDCAD 1 hour
On the 1 hour chart, we can
see that we have a minor resistance zone around the 1.4090 level. The sellers
will likely keep on stepping in around the resistance to target the 1.3950
support, while the buyers will look for a break higher to increase the bullish
bets into a new cycle high. The red lines define the average daily range for today.
Upcoming
Catalysts
Today,
we get the latest US Jobless Claims figures, while tomorrow we conclude the
week with the Canadian labour market data and the US NFP report.
