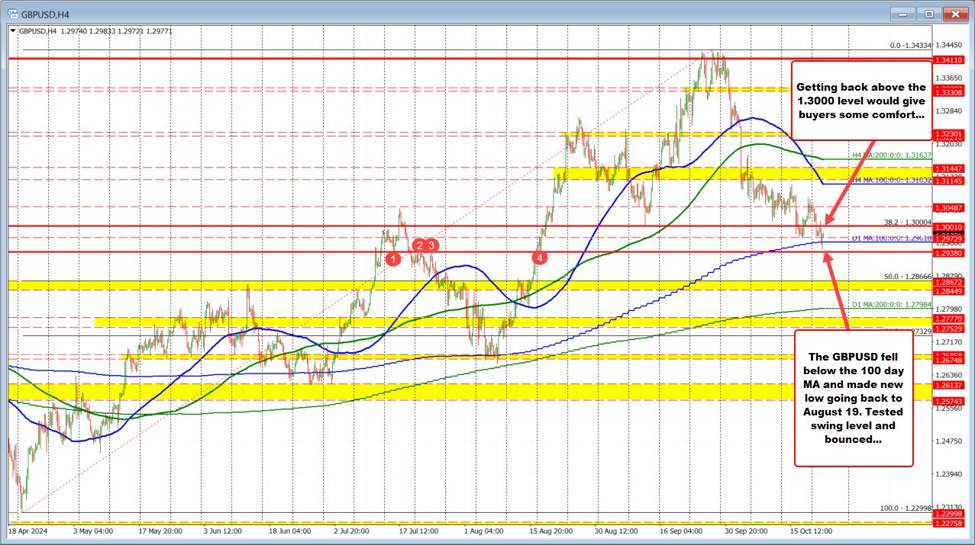
At the start of the US session today I posted on the GBPUSD:
GBPUSD: Traders have been targeting the 100 day MA and the 61.8% of the move up from the August low at 1.2962 and 1.2958. The low price today reached within 3 pips of the 100 day MA at 1.2965 and bounced to 1.2984. Break below and traders will target 1.2938 followed by 1.2844 to 1.2867. The overhead resistance is at 1.3000 where the low from September 11 bottomed (before bouncing). PS the price did break above the 1.3000 earlier today, but the high price also stalled at the falling 100 hour MA. That level comes in at 1.3010. So 1.3000 to 1.3010 is really my best topside resistance/bias defining level. Until broken, the selelrs are in more control.
So what happened.
The price did move below the 100-day MA and the 61.8% retracement but fell short of the next target that would have opened the downside for more probing. The low reached 1.29438. The price moved back above the 100 day MA and has moved up to 1.2983.
The price is between the 1.3000 level and the falling 100-hour MA which is now at 1.30076 (and moving lower) and back above the 100 day MA at 1.29619.
Looking at the hourly chart below, the high price today reached the 100 hour MA and stalled. That increases the levels importance going forward. So if the price reaches the 1.3000 level in the new day (it will), that will add to that level importance as well
.
