Fundamental
Overview
Late Thursday, around 1:00
PM ET, WSJ’s Timiraos published an article which seemed suggesting that a 50
bps cut was still being discussed. The market responded by raising 50 bps cut
probabilities to around 40% from 13% before the news.
Nick Timiraos is considered
a Fed “insider”, so the market is attentive to all of his pieces concerning
potential Fed decisions. The probability for the Fed to cut by 50 bps at the
upcoming meeting stand now around 60% with a total of 118 bps of easing by
year-end.
These repricing weakened
the US Dollar across the board as Treasury yields fell further. Once we are done
with the Fed decision, the focus will switch back to the economic data. In case
we start to see better figures, the market might start to pare back the
aggressive easing expected in 2025 supporting the greenback in the short-term.
For the SNB, the market
sees a 37% probability of a 50 bps cut at the upcoming meeting and a total of 57
bps of easing by year-end. The central bank is not happy with the CHF strength
so they might either cut by 50 bps or jawbone the currency.
USDCHF
Technical Analysis – Daily Timeframe
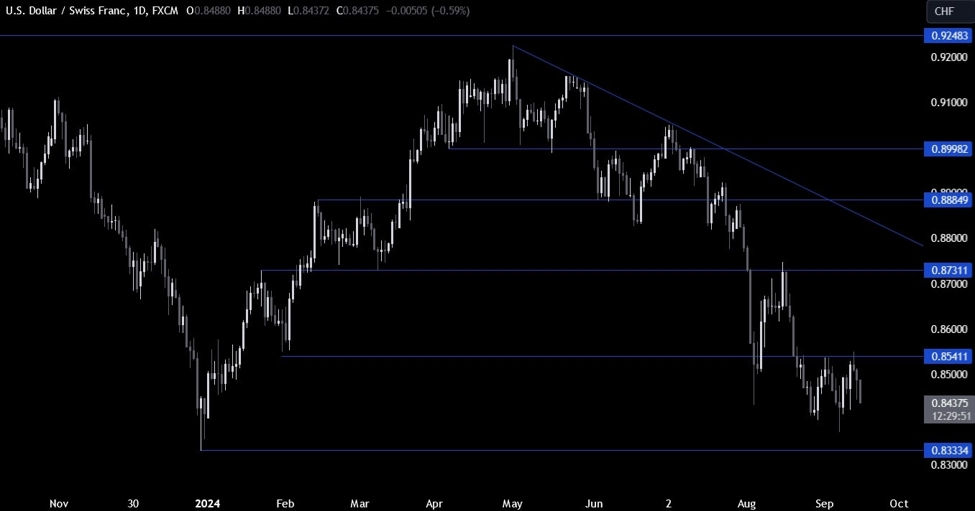
USDCHF Daily
On the daily chart, we can
see that USDCHF rejected the key 0.8555 resistance
and dropped back to the recent lows. The target for the sellers should be the
0.8333 level which is where we will likely find the buyers stepping in with a
defined risk below the level to position for a rally back into the 0.8555 resistance.
USDCHF Technical
Analysis – 4 hour Timeframe
USDCHF 4 hour
On the 4 hour chart, we can
see that we had a strong resistance around the 0.8555 level where we had also the
major trendline for confluence. That’s where the sellers piled in
to position for a drop into the 0.8333 level and increase the bearish bets on
the break of the counter-trendline.
There’s not much here for
the buyers to work with, so they can either wait to buy the dip around the
0.8333 level or look for a break above the major trendline to start targeting
new highs.
USDCHF Technical
Analysis – 1 hour Timeframe
USDCHF 1 hour
On the 1 hour chart, we can
see that we have a minor support around the 0.8420 swing level. That’s also
where we can find the lower bound of the average daily range for today, so in case the price
falls into that level, we can expect the buyers to step in to target a pullback
into the major trendline. The sellers, on the other hand, will want to see the
price breaking lower to increase the bearish bets into the 0.8333 level.
Upcoming
Catalysts
Tomorrow we get the US Retail Sales and the US Industrial Production data. On
Wednesday, we have the FOMC Rate Decision. On Thursday, we get the latest US
Jobless Claims figures.