Fundamental
Overview
Yesterday, we got the US CPI report and, although as expected it didn’t
have the same large impact as it used to, the core m/m figure surprised to the
upside. The shelter component re-accelerated and that’s something to keep an
eye on given the imminent rate cut cycle.
The data triggered a
repricing in interest rates expectations with the market now seeing just a 13%
probability of a 50 bps cut at the upcoming FOMC meeting and less easing
further out the curve.
For the SNB, the market
expects the central bank to cut by 25 bps at the upcoming meeting with a total
of 55 bps of easing seen by year-end.
Right now, it looks like
the Fed is going to cut rates into a resilient economy, so one has to be
mindful that we might eventually get an increase in economic activity and in long
term yields which should boost the US Dollar.
USDCHF
Technical Analysis – Daily Timeframe
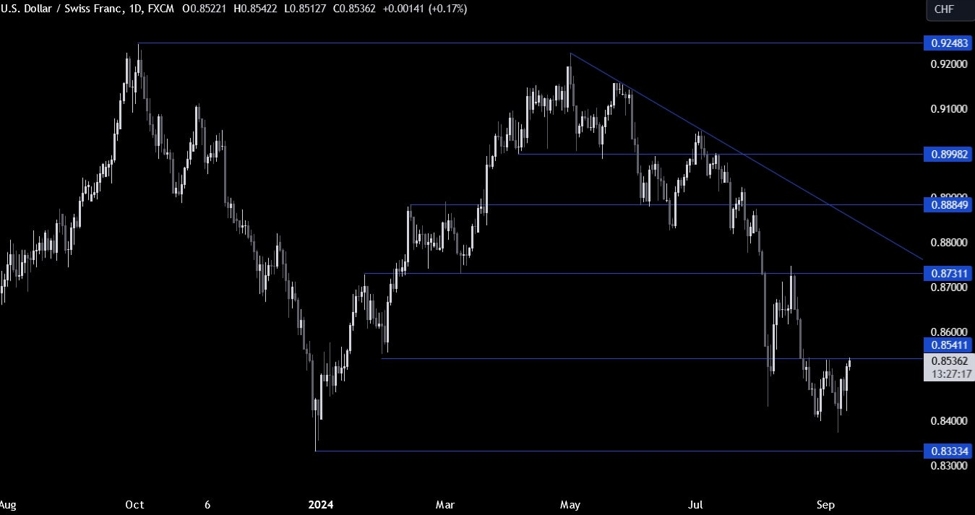
USDCHF Daily
On the daily chart, we can
see that USDCHF is now testing the key 0.8555 level. This is where we can
expect the sellers to step in with a defined risk above the level to position
for a drop into the 0.8333 level. The buyers, on the other hand, will want to
see the price breaking higher to increase the bullish bets into the 0.8731
level next.
USDCHF Technical
Analysis – 4 hour Timeframe
USDCHF 4 hour
On the 4 hour chart, we can
see that we have a strong resistance around the 0.8555 level where we
can find the confluence of the trendline and the previous swing high level. This
is going to be a tough nut to crack for the buyers but if they manage to do so,
we can expect the bullish momentum to increase and the rally to extend to
0.8731 level.
USDCHF Technical
Analysis – 1 hour Timeframe
USDCHF 1 hour
On the 1 hour chart, we can
see that we have a minor support zone around the 0.8515 level. If we get a
pullback from the 0.8555 level, we can expect the buyers to step in around the
support to position for a break above the trendline.
The sellers, on the other
hand, will want to see the price breaking lower to increase the bearish bets
into the upward trendline around the 0.8450 level. The red lines define the average daily range for today.
Upcoming
Catalysts
Today we get the latest US Jobless Claims figures and the US PPI data. Tomorrow,
we conclude the week with the University of Michigan Consumer Sentiment report.