Fundamental
Overview
The USD continues to be
backed by good economic data as we have also seen recently from the US PMIs last Friday and the US Consumer Confidence report this week. Yesterday, we
also got the US Jobless Claims figures where the data showed that
the labour market continues to rebalance via less job availability rather than
more layoffs.
Such data keeps the
interest rates expectations stable around two cuts by the end of the year and
supports the risk sentiment amid a pickup in growth without inflationary
pressures.
The GBP, on the other hand,
has been under pressure since the BoE policy decision where the central bank delivered
some dovish signals and kept the door open for a rate
cut in August. This week the Pound has been under pressure mainly due to some
US Dollar strength.
It looks like the price
action this week has been influenced more by month-end, quarter-end and mid year-end
flows rather than something fundamental.
GBPUSD
Technical Analysis – Daily Timeframe
GBPUSD Daily
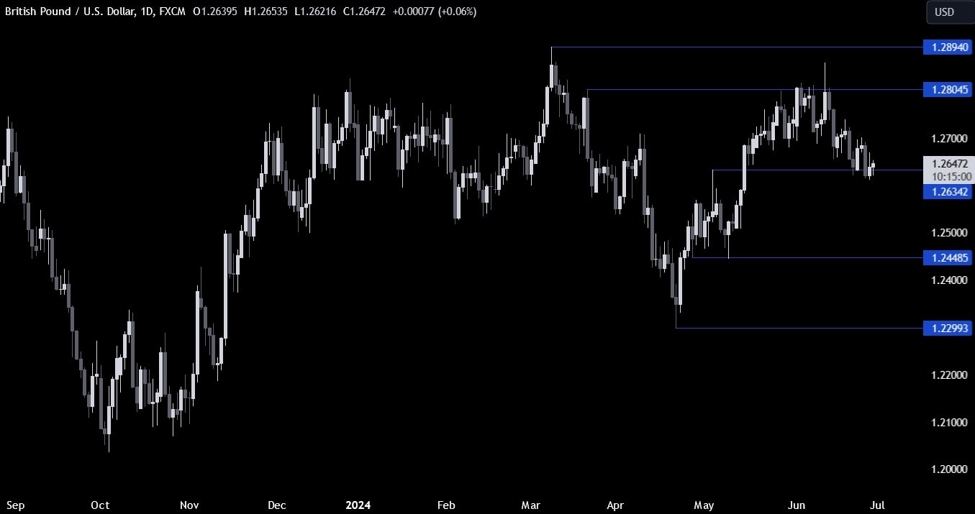
On the daily chart, we can
see that GBPUSD bounced once again from the support at 1.2635 today as the buyers continue to step
in around this level to position for a rally into new highs with a better risk
to reward setup. The sellers, on the other hand, will want to see the price
breaking lower to gain more conviction and increase the bearish bets into the
1.25 handle next.
GBPUSD Technical
Analysis – 4 hour Timeframe
GBPUSD 4 hour
On the 4 hour chart, we can
see that the downside momentum seems to be slowing as the lower lows get
shallower. This might be a signal for a reversal, although a break to the
downside could invalidate it.
The buyers will want to see
the price breaking above the downward trendline to gain more conviction and
increase the bullish bets into the 1.28 handle. The sellers, on the other hand,
might lean on the trendline to position for a break below the support with a
better risk to reward setup.
GBPUSD Technical
Analysis – 1 hour Timeframe
GBPUSD 1 hour
On the 1 hour chart, we can
see that we’ve been ranging for the entier week as flows have been dominating the price action and the market awaits
new catalysts to push it in either direction. There’s not much else to do here other than waiting for the price to reach the key levels or provide some breakouts. The red lines define the average daily range for today.
Upcoming
Catalysts
Today we conclude the week with the US PCE report where the market expects
the Core PCE to fall further towards the Fed’s 2% target.

 RULE-BASED Pocket Option Strategy That Actually Works | Live Trading