
- Gold price declines after the release of US Nonfarm Payrolls data for May, shows a higher-than-expected change in employment.
- Gold was already trending lower after data unveiling PBoC reserves showed no change in May compared to April.
- Short-term technical picture remains volatile as Gold whipsaws higher and then lower.
Gold (XAU/USD) falls over half percentage point to the $2,320s on Friday after the release of US Nonfarm Payrolls (NFP) data shows the US economy added 272K jobs in May wqhen 185K had been expected. The result wa salso higher than the April figure which was revised down to 165K.
The US Bureau of Statistics (BLS) report also showed a rise in Average Hourly Earnings of 4.1% YoY from a revised up 4.0% in April, and beating estimates of 3.9%.
The Unemployment Rate rose to 4.0%, however, when 3.9% had been forecast from 3.9% previously,
Overall the BLS data suggests wage inflation is rising which could feed into higher core and headline inflation. This, in turn, could lead the Federal Reserve (Fed) to delay its decision to cut interest rates. Maintaining higher interest rates for longer is negative for Gold as it raises the opportunity cost of holding a non-yielding asset.
Gold was already falling on Friday after the news that the People’s Bank of China (PBoC) suddenly halted its Gold purchases in May after an 18-month stretch of buying.
Gold price deflates after People’s Bank of China halts further buying
Gold is trending lower at the end of the week after the news that Gold reserves at the PBoC remained unchanged at 72.8 million troy ounces at the end of May, the exact same figure as at the end of April, according to official data from the PBoC on Friday.
The data follows strong buying in April that saw China Gold reserves at the PBoC hit an all-time high, accounting for 4.9% of total reserves, and following 18 consecutive months of growth.
Central bank buying, especially in Asia, is now a key driver of Gold price. It was probably behind the rally in 2024 which saw Gold reach a record high of $2,450 in May. According to the World Gold Council (WGC) unreported over-the-counter buying (i.e not through exchanges) by central banks was a significant driver of Gold’s strength.
“Looking at our Gold Return Attribution Model (GRAM), there was no single variable that stood out as a key driver in May,” says the WGC report for May. “Momentum and a weaker US Dollar were positive drivers but their impact was marginal. And while the unexplained component of the model shrank considerably in May, it was still the largest factor by far. As we have noted previously, we believe some of this can be attributed to strong over-the-counter buying, including central bank purchases which have been a notable contributor to recent Gold returns.”
Asian and emerging market country central banks have been hoarding Gold reserves as a hedge against the threat of devaluation of their own currencies, especially against the US Dollar (USD). The revision of interest-rate expectations by the Federal Reserve (Fed) in the spring led to a strengthening of USD, which increased the reserve-hoarding trend.
That said, a recent run of poor US data means investors are renewing bets the Fed will start cutting interest rates in September, with the probabilities at around 67%, according to the CME FedWatch tool, which bases its estimates on 30-day US Fed Fund Futures pricing data.
Additionally, at a global level, interest-rate expectations are falling. On Wednesday, the Bank of Canada (BoC) cut its overnight rate to 4.75% from 5.00% and the European Central Bank (ECB) followed the day after. The release of lower inflation data in Switzerland has now prompted speculation the Swiss National Bank (SNB) could also cut interest rates at its June 20 meeting following an earlier cut in March.
Technical Analysis: Gold breaks out of top of range, then dumps
Gold price has broken out of the top of a mini-range, stretching from roughly $2,315 to $2,358, but since reversed course and dumped. It has now fallen back inside the range.
XAU/USD 4-hour Chart
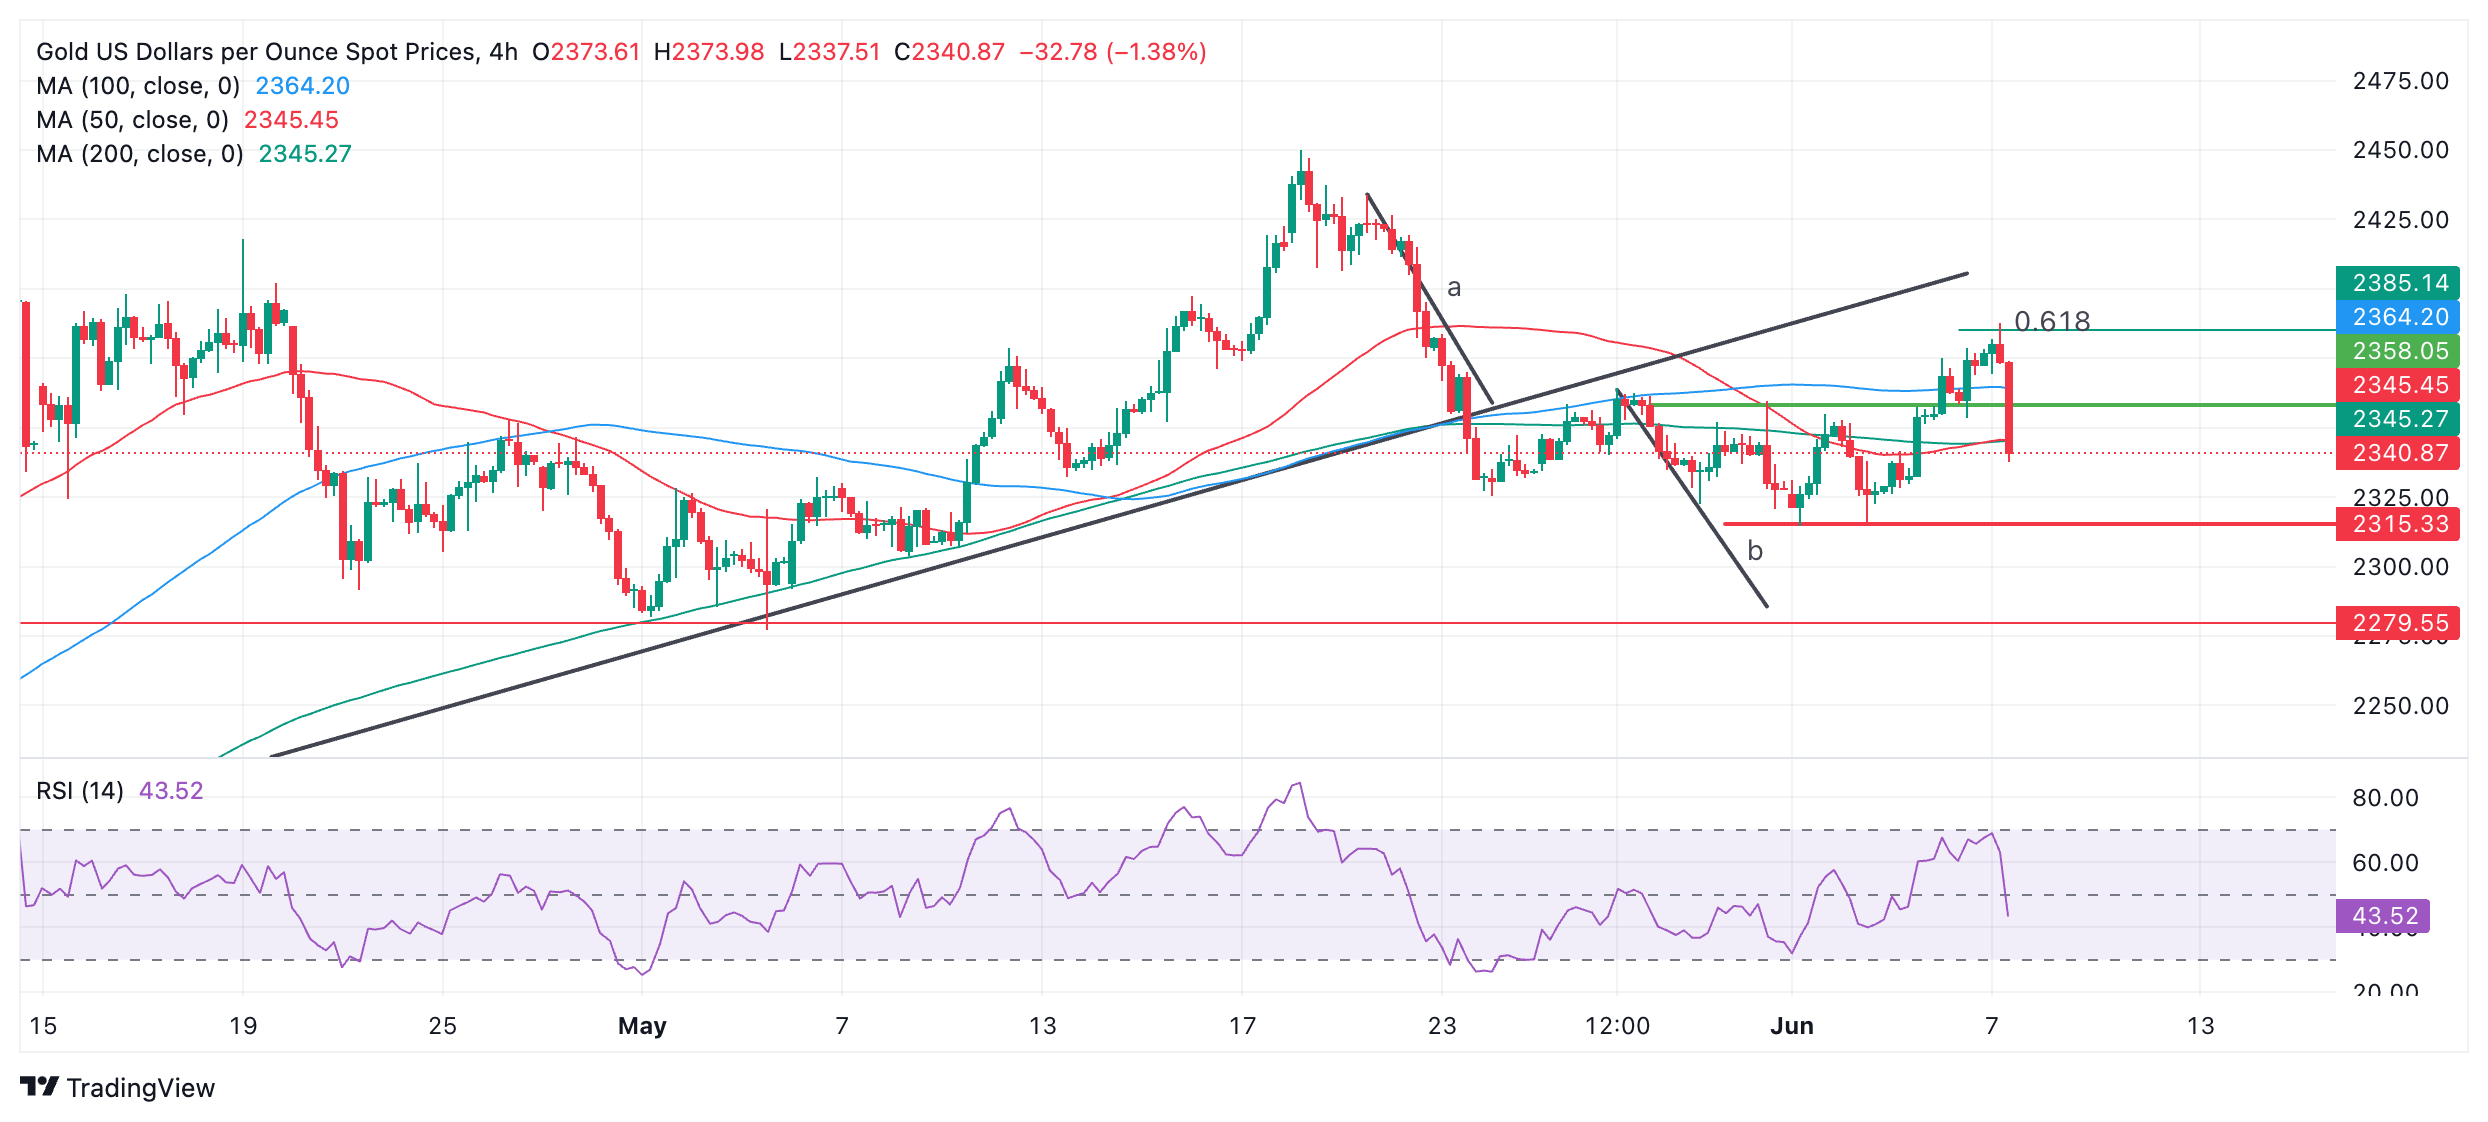
A break below the $2,315 range low would reactivate downside targets generated by the trendline break. The first target for the follow-through is at $2,303 – the 0.618 Fibonacci extrapolation of “a”. A stronger move down could even see Gold reach support at $2,279. The targets are calculated using the length of the move prior to the break as a guide.
On Thursday, Gold broke out of its mini-range and hit an initial target at $2,385, the 0.618 Fibonacci extrapolation of the height of the range from the breakout point higher, before reversing and crashing back down on Friday.
Despite the short-term weakness, the precious metal’s medium and long-term trends are still bullish, and the risk of a recovery remains high.
Economic Indicator
Nonfarm Payrolls
The Nonfarm Payrolls release presents the number of new jobs created in the US during the previous month in all non-agricultural businesses; it is released by the US Bureau of Labor Statistics (BLS). The monthly changes in payrolls can be extremely volatile. The number is also subject to strong reviews, which can also trigger volatility in the Forex board. Generally speaking, a high reading is seen as bullish for the US Dollar (USD), while a low reading is seen as bearish, although previous months’ reviews and the Unemployment Rate are as relevant as the headline figure. The market’s reaction, therefore, depends on how the market assesses all the data contained in the BLS report as a whole.