The economic calendar is empty in the European session, so the market will likely keep trading based on the yesterday’s benign US CPI report which should have set the positive trend in risk assets for the next few weeks.
There is a data point that could ruin the positive mood though: the US Jobless Claims data.
US JOBLESS CLAIMS 12:30 GMT (08:30 ET)
The US Jobless Claims continue to be one
of the most important releases to follow every week as it’s a timelier
indicator on the state of the labour market. This is because disinflation to
the Fed’s target is more likely with a loosening labour market. A strong
labour market could make the achievement of the target more difficult.
Initial Claims keep on hovering around cycle lows, while Continuing Claims
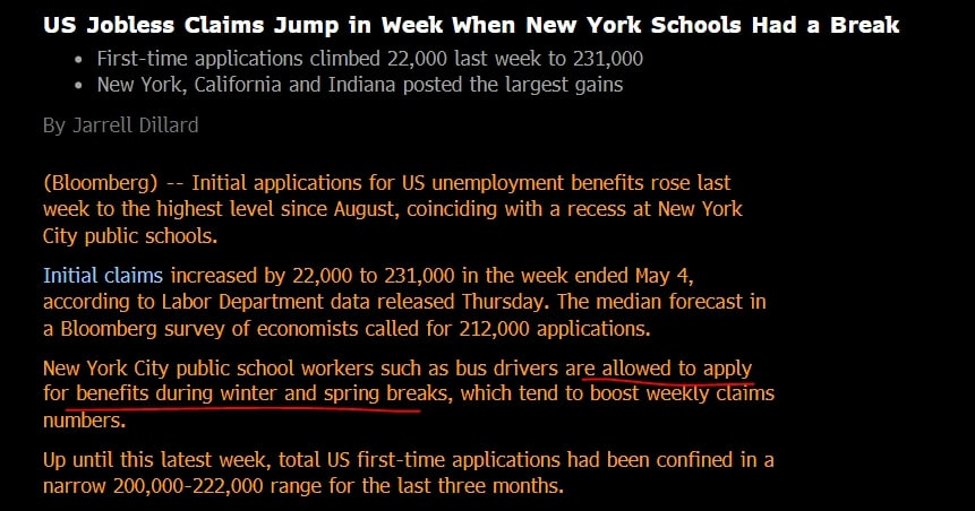
remain firm around the 1800K level. Last week, Initial Claims surprisingly missed expectations and spiked to the highest level since August 2023.
Bloomberg reported that the spike coincided with a recess at New York City public schools. So, the markets will want to see if last week’s numbers were a start of a trend (considering the leading indicators pointing to weaker labour market) or just a blip.
US Jobless Claims (image from @Credit_Junk on X)
Today Initial Claims are expected at 220K
vs. 231K, while Continuing Claims are seen at 1780K vs. 1785K prior.
WHY IT MATTERS?
The
data tracks new filings for unemployment insurance benefits from the
prior week, that’s why the actual name of the report is “weekly claims
for unemployment insurance”. If people lose their jobs, they apply for
unemployment insurance which will be reflected in the data. Higher
unemployement is bad for the economy as that will lead to lower spending
and businesses paring back investments. On the other hand, a low level
of filings can indicate a strong labour market which is good for the
economy as a whole.
The jobless claims data is
considered a leading indicator due to its timeliness and it’s included
in the Conference Board Leading Economic Index (LEI). One caveat is that
not everyone is entitled to unemployment benefits which sometimes can
lead to big gaps between the total number of people unemployed and those
receiving unemployment benefits. Moreover, the data can be volatile
from one week to another, so one should not rush to conclusions based on
a single release.
Nevertheless, it’s still a
good and timely barometer on the state of the labour market. Generally,
figures above the 300K level signal a deterioration in the labour market
with the 400K level potentially indicating a recession underway. This
is also true for continuing claims although the level is around the
3000K mark. Of course, the data always needs to be taken in the right
context and the focus should also be on the trend and the rate of
change.
US Jobless Claims
OTHER RELEASES
We will also get other economic reports in the US session which shouldn’t be market moving but are worth watching in the grand scheme of things. In order of importance:
- US Industrial Production and Capacity Utilization 13:15 GMT (09:15 ET).
- US Housing Starts and Building Permits 12:30 GMT (08:30 ET).
- US Philly Fed Manufacturing Index 12:30 GMT (08:30 ET).
The Fed speakers are unlikely to deviate from their prior comments as they will want to maintain the status quo for the time being:
- Fed’s Barr (dove – voter) 14:00 GMT (10:00 ET).
- Fed’s Harker (neutral – non voter) 14:30 GMT (10:30 ET).
- Fed’s Mester (neutral – voter) 15:30 GMT (11:30 ET).
- Fed’s Bostic (hawk – voter) 19:50 GMT (15:50 ET).
