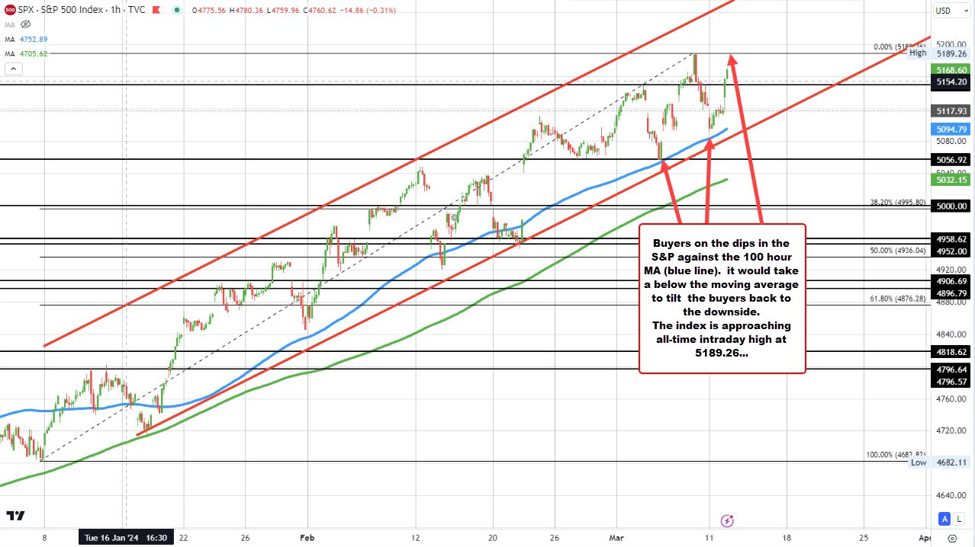
The broader US stock indices are moving to new session highs with the S&P trading up 1%. The NASDAQ and is up 1.25%.
Looking at the hourly chart of the S&P index above, last week the low price based against swing lows from February 27 to February 29 near 5056.92. Also near that level was the 100-hour moving average. Buyers leaned against that area on March 5, and rose to the new all-time highs on Friday at 5189.26 before starting a corrective move to the downside (also on Friday).
On Monday, the price opened lower and sniffed the 100-hour moving average again, but found willing buyers against the level and the price has stepped higher with more momentum today.
Going forward, it would take a move below the 100-hour moving average at 5094.76 (and rising) to tilt the technical bias – at least in the short term – back to the downside. After breaking that level, the rising 200-hour moving average would still need to be broken to add to the bearish bias. Until then the buyers are in control in that index.
For the Nasdaq index, for this week, the price did extend below its 100 hour moving average on Monday and again in the early trading today. However, each move to the downside was limited, and the buying today has now extended the price away from that key technical barometer.
Admittedly, unlike the S&P, the price has seen dips below the 100-hour moving average going back in time (just follow the blue line and the price action on the chart below). However, the 200 hour moving average (the green line in the chart below) has done well in holding support.
Going forward, a move below the 100-hour moving average (blue line currently at 16039.56) is needed to tilt the bias to the downside but traders will also be watching the rising 200-hour moving average for a more bearish tilt. That level currently comes in at 15859.46.
