- New Zealand Dollar weakens against the US Dollar following the latest US inflation figures for February.
- They paint a picture of stubbornly hot inflation, which could make the Fed keep interest rates elevated to cool.
- The NZD/USD pair is falling back down towards its range lows in the 0.6080s.
The New Zealand Dollar trades lower against the US Dollar on Tuesday after the release of US Consumer Price Index (CPI) data for February shows inflationary pressures in the American economy remain stubbornly high.
The data suggests the Federal Reserve (Fed) may have to keep interest rates higher for longer to cool the economy. Relatively higher interest rates for longer is a positive driver for the US Dollar as it attracts more foreign capital inflows.
The fact that Gasoline and Energy prices were two of the biggest contributors to elevated inflation, however, will probably limit US Dollar upside since these are seen as less entrenched pressures and subject to global commodity price fluctuations.
New Zealand Dollar declines vs US Dollar after US CPI beat
The New Zealand Dollar takes another step lower against the US Dollar on Tuesday after both headline and core US CPI for February came out above estimates, according to data from Bureau of Labor Statistics (BLS).
The US Consumer Price Index ex Food and Energy (core) inflation came out at 3.8% YoY when analysts had expected a 3.7% result. The figure was lower than the 3.9% recorded in January, however, suggesting inflation is coming down, only not as quickly as forecast.
On a monthly basis, core CPI rose 0.4%, which was higher than the 0.3% forecast and equal to the 0.4% recorded in January.
The broader headline CPI figure showed an unexpected rise of 3.2% YoY against the 3.1% forecast. This was also higher than the 3.1% recorded in January.
On a monthly basis headline CPI rose 0.4%, which was in line with estimates and higher than the 0.3% registered in January.
According to the CME FedWatch Tool, which calculates a market-based expectation of when the Federal Reserve will begin reducing its Fed Funds Rate, the probability of a first rate cut in March has fallen to 1% from 3% prior to the CPI release. The chance of one or more 25 bps cuts by May is now 16.8% from 17.1% prior to the CPI release. The probability of one or more interest rate cuts by June is now 69.7% from 71.4% prior to the data.
Technical Analysis: New Zealand Dollar continues falling inside range
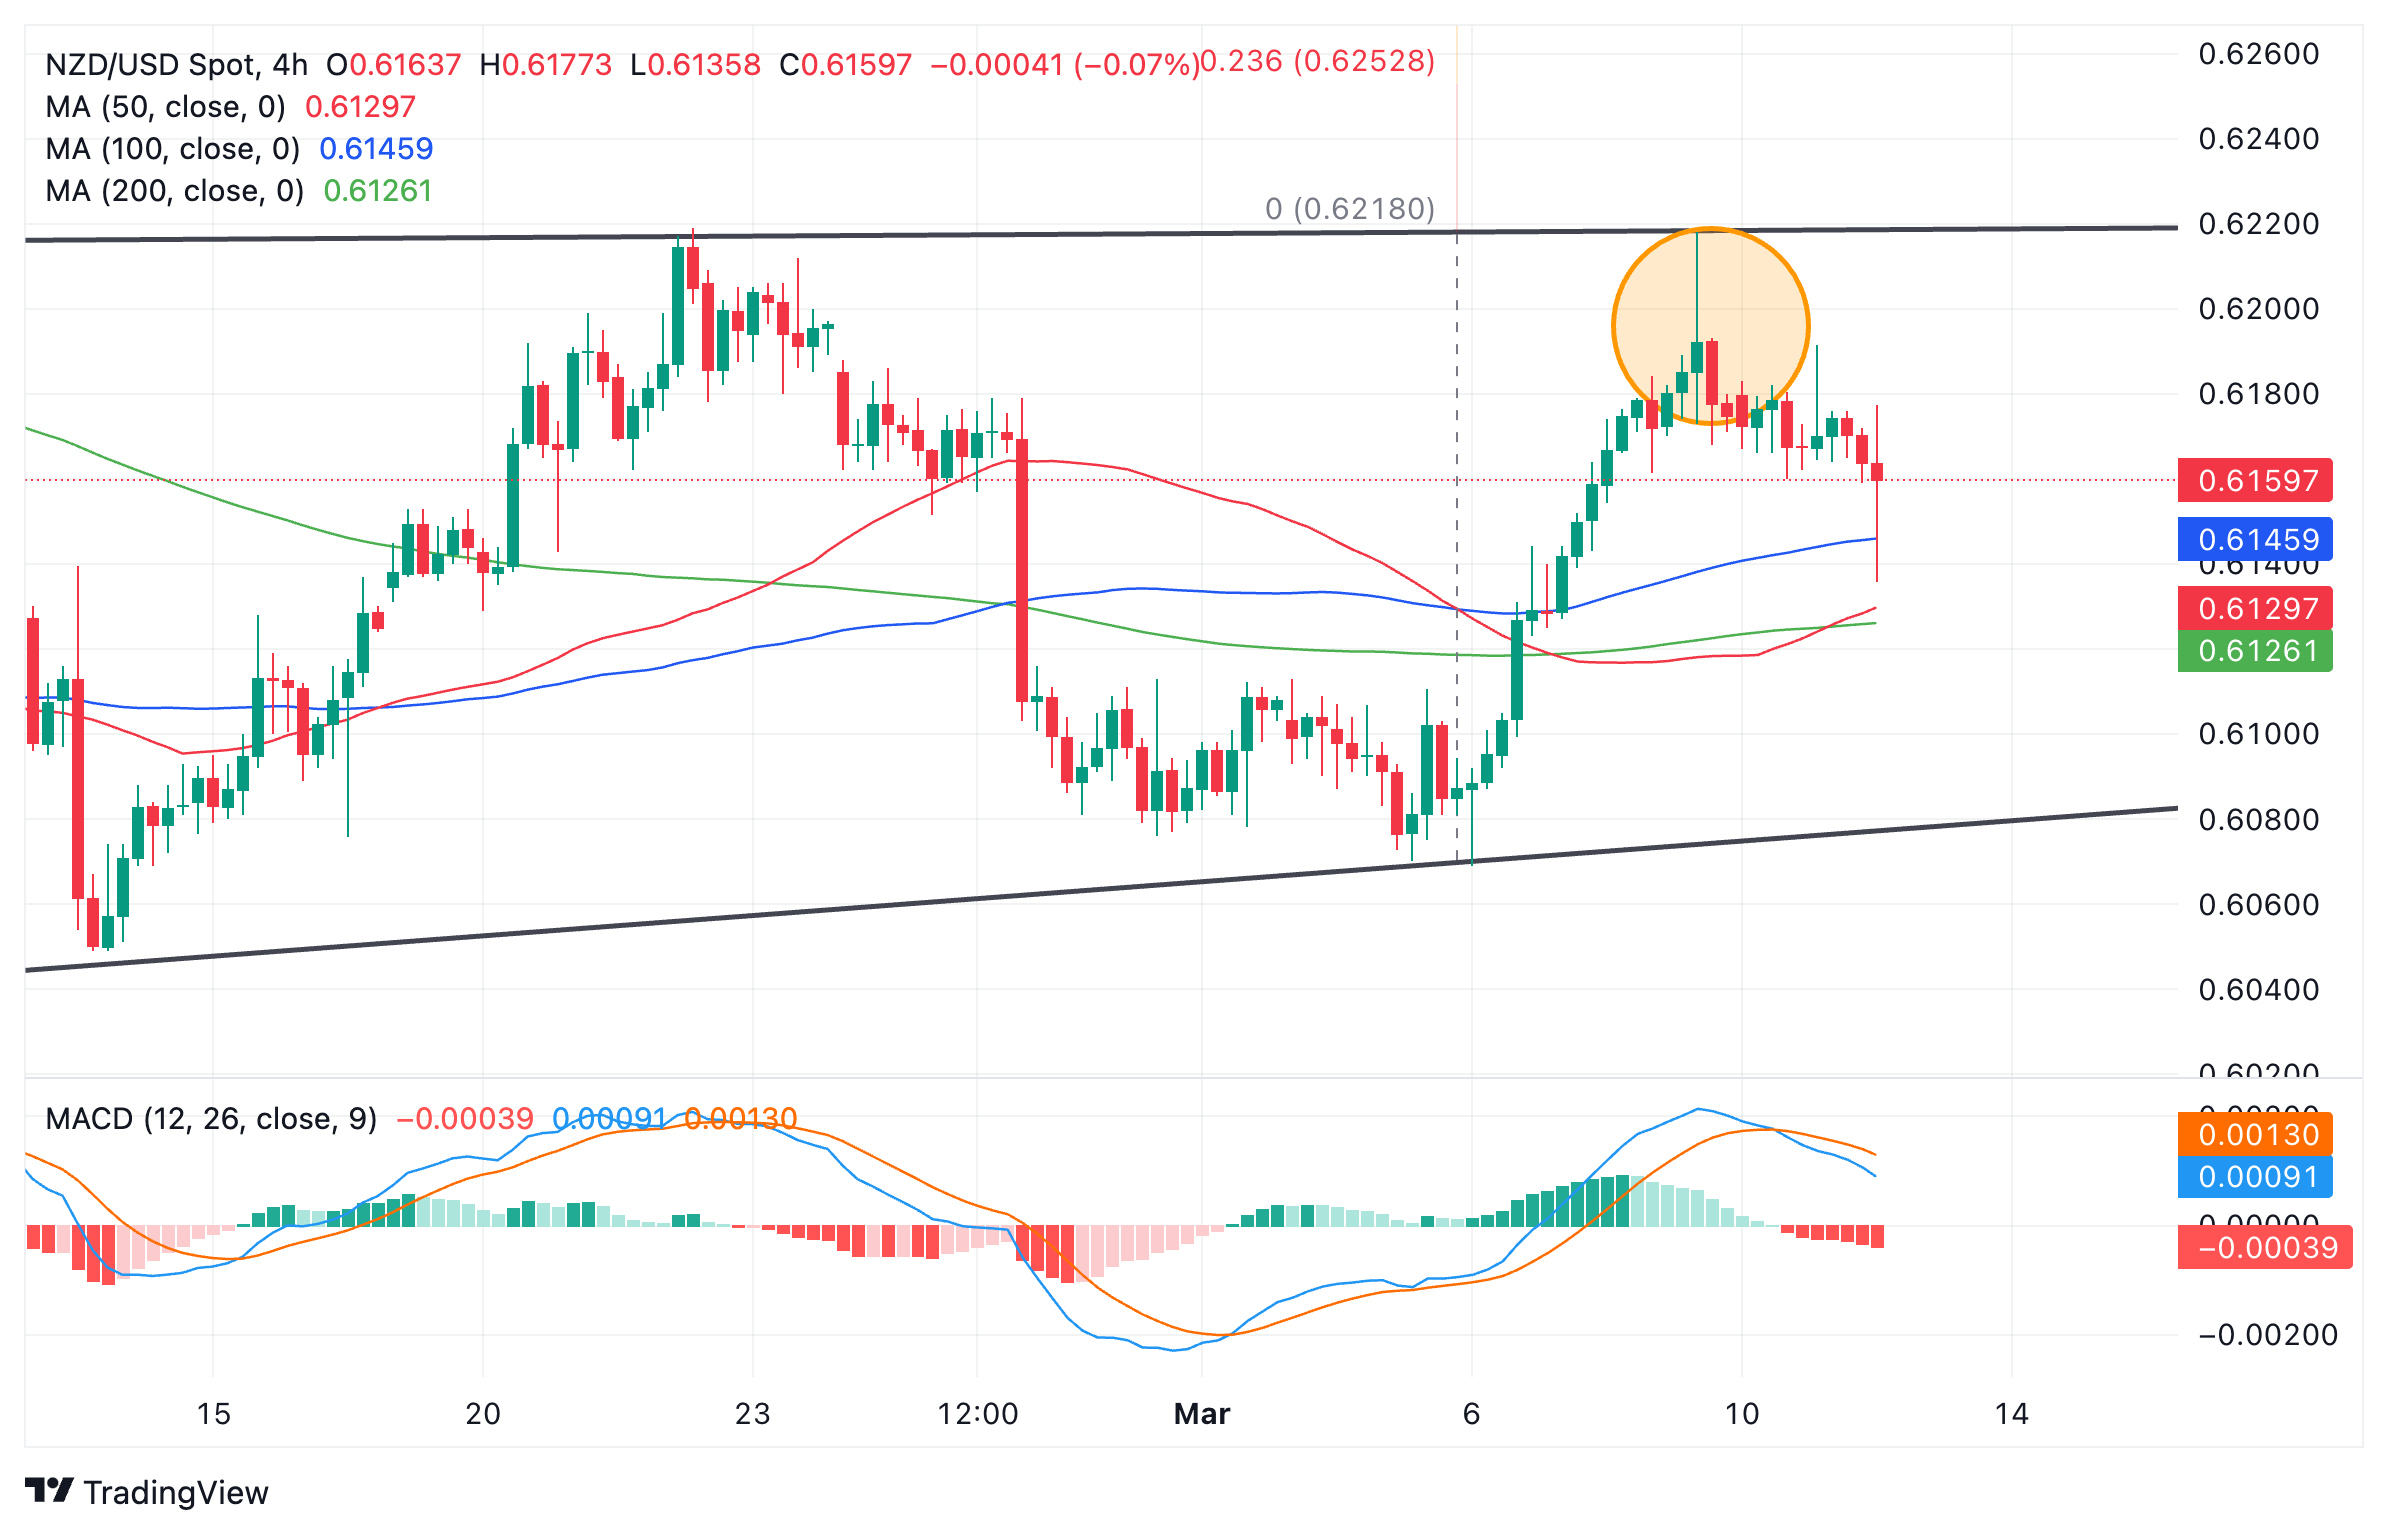
The NZD/USD pair continues falling after touching the top of its range in the 0.6220s on Friday, where it formed a bearish Shooting Star Japanese candlestick pattern on the 4-hour chart (circled).
New Zealand Dollar vs US Dollar: 4-hour chart
The combination of the Shooting Star, the range high and the downside move since suggest the short-term trend has changed, and the pair is descending within its range, back down towards the range lows at around 0.6080-90.
The move down was also accompanied by the Moving Average Convergence/ Divergence (MACD) indicator crossing below its signal line whilst in positive territory, adding credence to the bearish outlook.
Only a breakout above the range high and the high of the Shooting Star would suggest the market was going higher. Such a move would probably reach a target at 0.6309, the 61.8% Fibonacci extrapolation of the height of the range from the breakout point higher.
Economic Indicator
United States Consumer Price Index ex Food & Energy (MoM)
Inflationary or deflationary tendencies are measured by periodically summing the prices of a basket of representative goods and services and presenting the data as the Consumer Price Index (CPI). CPI data is compiled on a monthly basis and released by the US Department of Labor Statistics. The MoM print compares the prices of goods in the reference month to the previous month.The CPI Ex Food & Energy excludes the so-called more volatile food and energy components to give a more accurate measurement of price pressures. Generally speaking, a high reading is seen as bullish for the US Dollar (USD), while a low reading is seen as bearish.
The US Federal Reserve has a dual mandate of maintaining price stability and maximum employment. According to such mandate, inflation should be at around 2% YoY and has become the weakest pillar of the central bank’s directive ever since the world suffered a pandemic, which extends to these days. Price pressures keep rising amid supply-chain issues and bottlenecks, with the Consumer Price Index (CPI) hanging at multi-decade highs. The Fed has already taken measures to tame inflation and is expected to maintain an aggressive stance in the foreseeable future.

