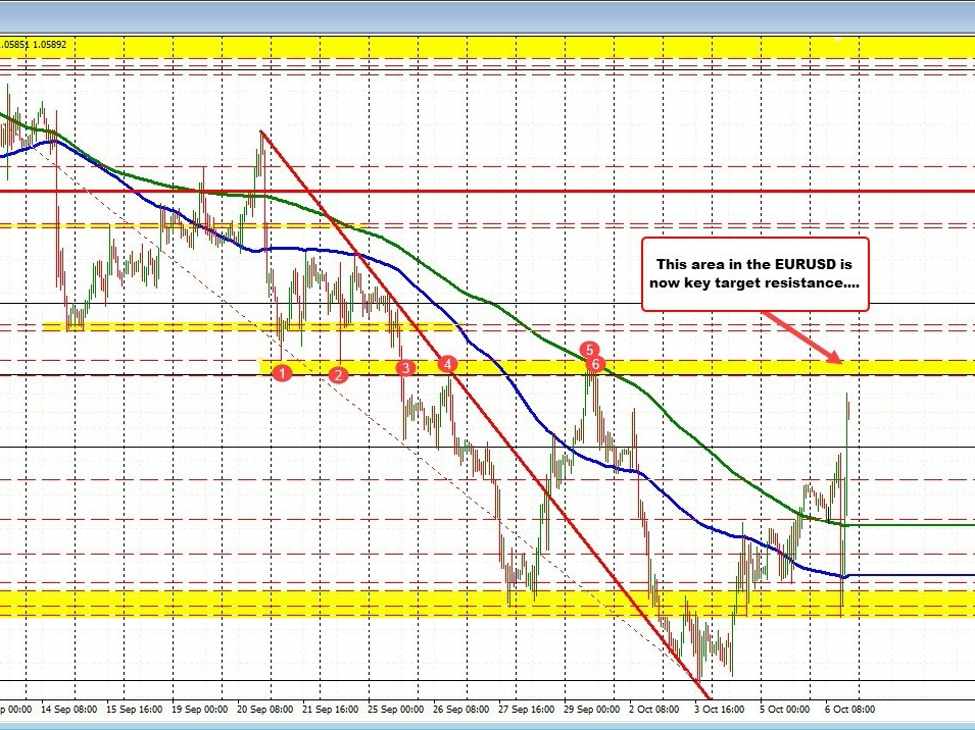
Whether you like the price action or not, the technicals in the EURUSD told the story for the price action.
Initially, the price moved sharply lower after the stronger-than-expected nonfarm payroll add. That move took the price to a key support level at 1.0483. I’ve outlined that level as a key downside target to get to and through if the sellers were to take more control. Not only has it been supported in the short-term, but is also a low support target level on the daily chart going back in time.
Holding that level gave the buyers some hope. Getting back above 100-hour movie under 1.0504 (and holding support on the correction) and then above the 200 hour moving average at 1.0530 (and holding support on the correction), was another clue that something was up and it was the EURUSD going higher.
What next?
There is a cluster of resistance near 1.06087 and 1.0616 on the hourly chart (see red numbered circles). It also represents the broken 38.2% retracement of the move up from the September 2022 load to the July 2023 high. The level comes in at 1.06108.
Traders looking to take profit or sell could lean against that area with a stop above 1.0616. On the downside moving back below 1.05709 could see a rotation further to the downside with the 200-hour moving average 1.0530 now support again.
