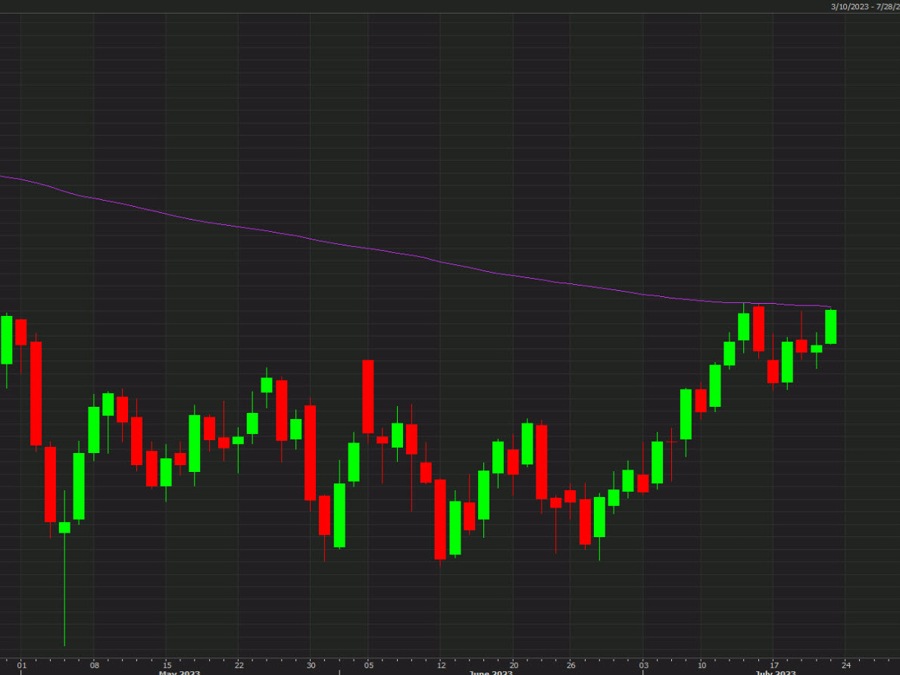
WTI w 200dma
The chart of WTI crude oil pretty much speaks for itself.
Baker Hughes reported that US drillers cut rigs by 7 this week and with the inventory of drilled but uncompleted wells nearly zeroed out, there aren’t many taps to turn on.
The message from the oil market is simply that $77 doesn’t incentivize spending like it used to. Because of inflation and demands for shareholder returns, the threshold for spending is higher. What also worries investors is that OPEC+ could return at any moment and swamp any marginally-economic project.
It’s all about the technicals though and $77.18 is the 200-dma and that needs to crack to get the bulls excited, and likely the July high of $77.32 as well. If those break, we could see some positions squeezed and momentum crank up.
