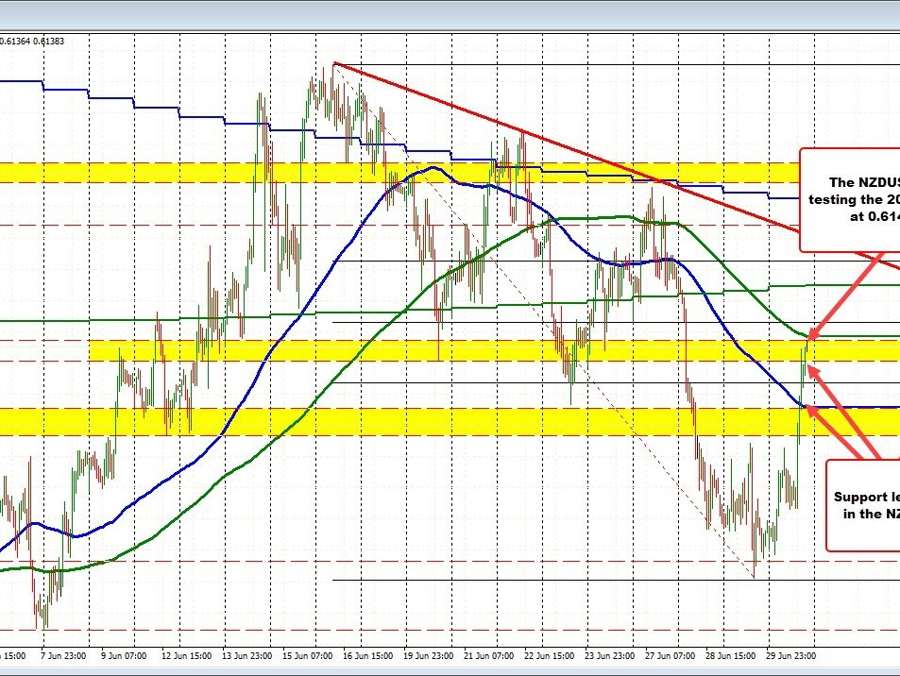
NZDUSD above the 100 hour MA and tests 200 hour MA
The NZDUSD has not escaped the USD selling today. The pair is up 1.15% on the day (NZD higher/USD lower). At current levels, it’s the largest increase since April 13 when the pair rose by 1.386%.
Looking at the hourly chart, the move to the upside took the price above a swing area between 0.6104 and 0.6114. Getting above the upper extreme also extended above the falling 100-hour moving average. That moving average currently comes in at 0.6115 (blue line in the chart above).
The continued momentum has taken the price now toward the pairs 200-hour moving average at 0.61423. The high price has reached 0.61408 just below that level. The current price trades at 0.6136. Sellers may look to lean against that moving average given the big move today. The low to the high trading range is 83 pips. The average of the last 22 trading days (around a month of trading) is 64 pips.
Sellers who leaned against the 200 hour MA level could stop themselves on a break above. The 50% at 0.61477 and the 200 day MA at 0.6161 are the next upside targets on more upside momentum. .
On the downside, a move back below 0.61327 would have traders looking toward the 38.2% retracement of 0.61243 and then the 100-hour moving average of 0.6115.
