- NZD/USD bulls are looking for a break to the upside to test trendline liquidity.
- All eyes are on the RBA meeting as per market correlations.
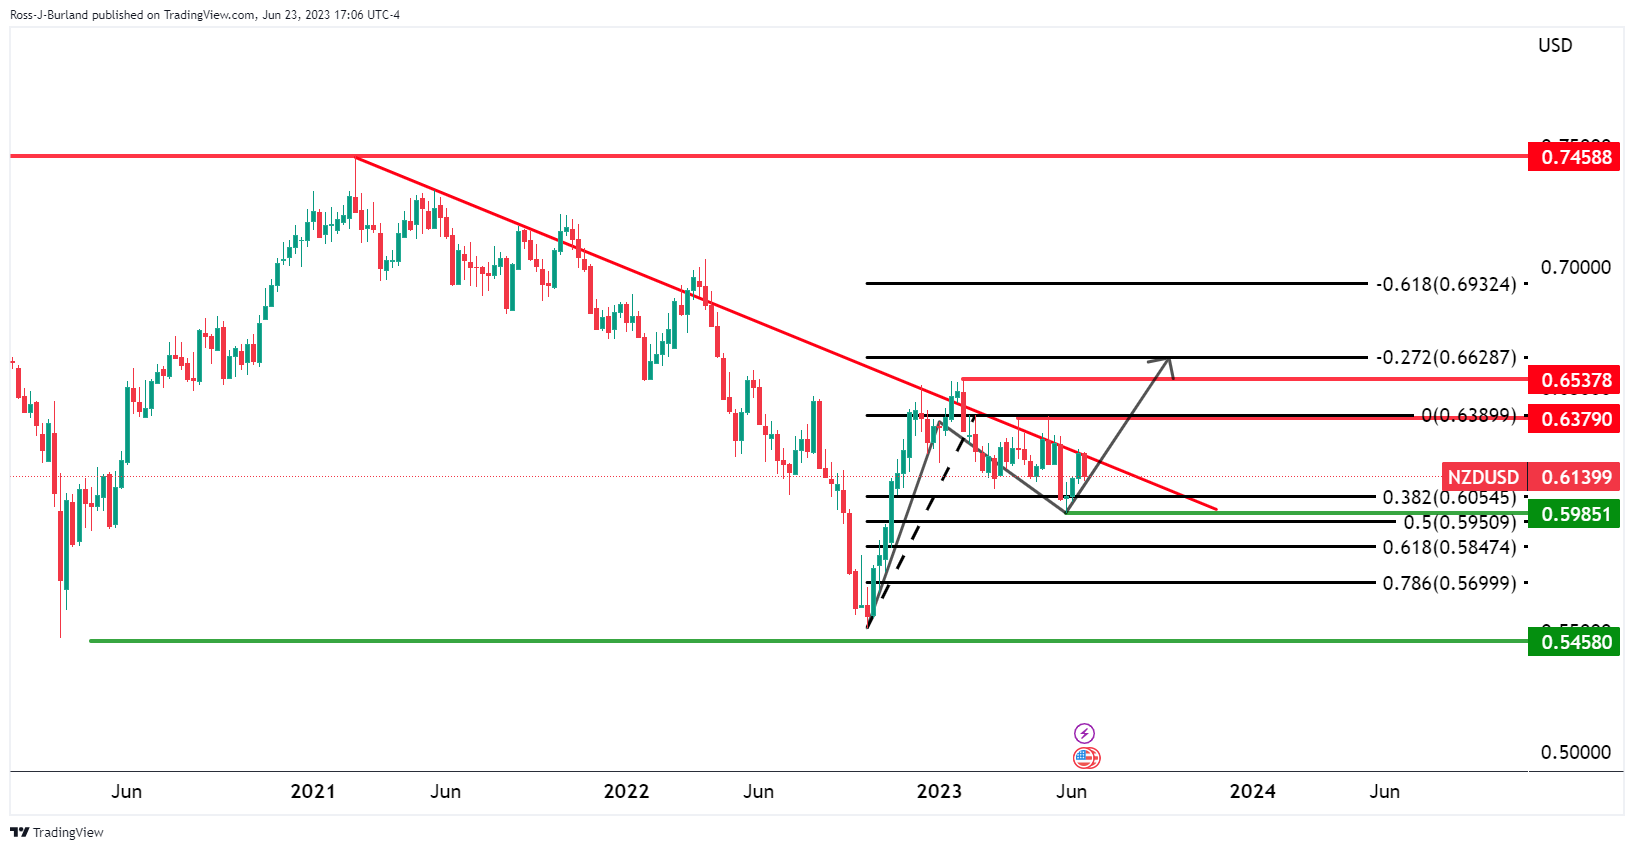
NZD/USD has been held below a key trendline resistance for a couple of years but it could be on the verge of a breakout to the upside. However, the Kiwi the Bird is being dominated by global moves until something notable happens in the region. All eyes are on the 4 July Reserve Bank of Australia decision until then.
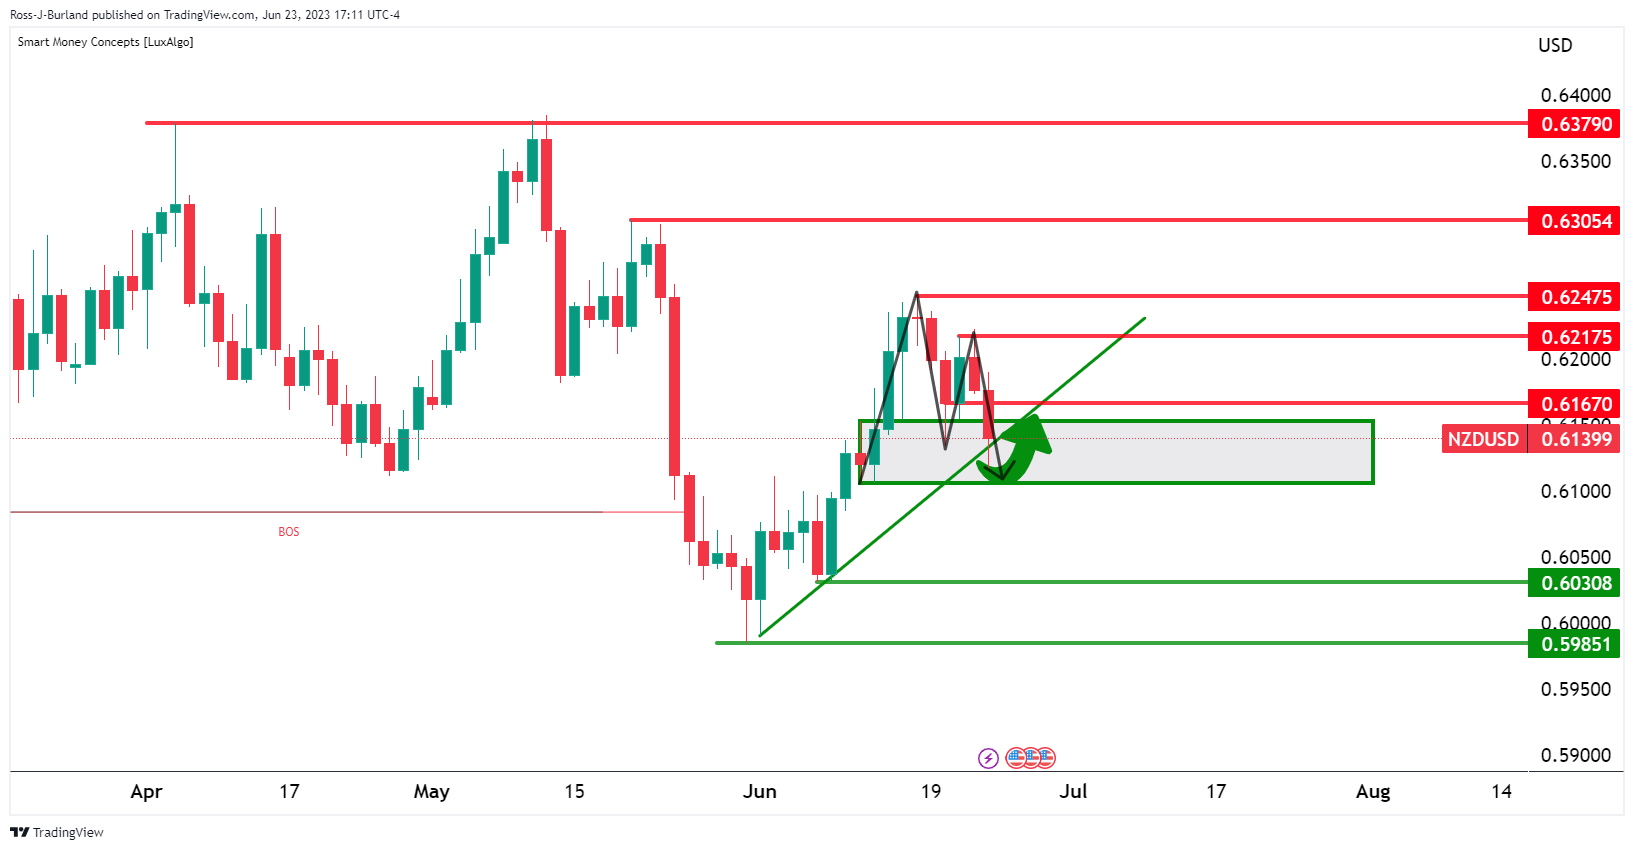
NZD/USD weekly and daily charts
Meanwhile, as per the technical analysis, the bulls are seeking a ride-up from daily trendline support as per the M-formation. A break of the 0.6250s and top of the right-hand shoulder opens the risk of a significant move higher in line with the weekly chart’s bullish bias. The market is based on the 50% mean reversion of the weekly charts’ bullish impulse.
This article was originally published by Fxstreet.com. Read the original article here.


