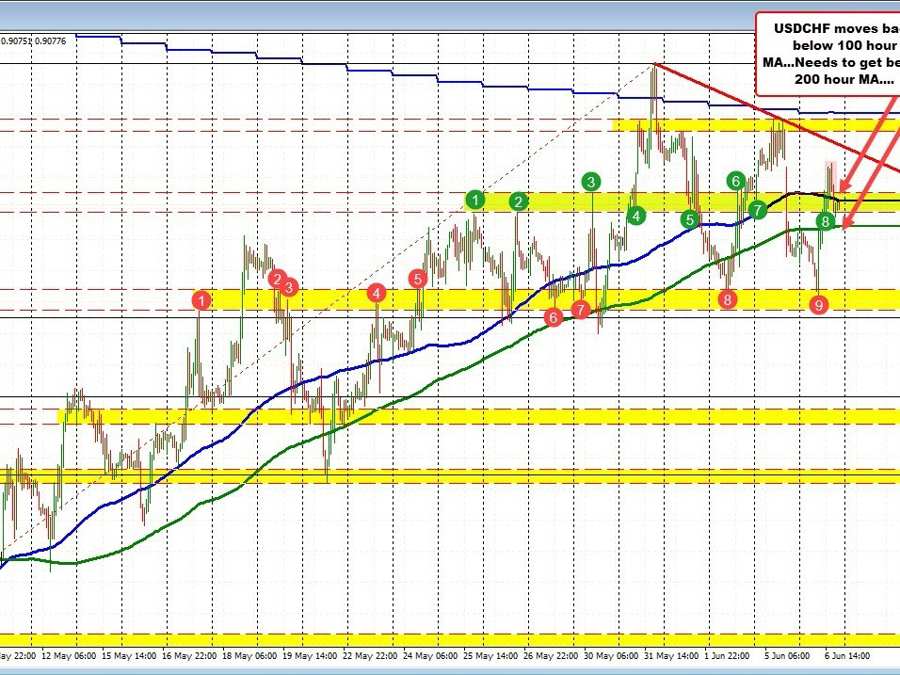
The USDCHF is mired in a up-and-down type of market environment. The downside, there is decent support near 0.9025 and 0.9035 (a red numbered circles).
USDCHF between the 100 and 200 hour moving averages
On the topside, price action over last 5 trading days comes between 0.9113 and 0.9119 (see blue numbered circles).
There had been moves above and below those areas (see red box above), but moves outside of the area have been brief and limited.
The current price trades between those extremes and also between the 100 hour moving average (blue line in the chart above) currently at 0.90795, and the 200 hour moving average (green line currently) at 0.90668. Trading between the moving averages is a neutral area and what has been an up-and-down trading range.
Nevertheless the moving averages will be a barometer for bullish above and bearish below, with the red box extremes as a next targets.
Today, the most recent price action took the price above the 200 hour moving average, but momentum faded. The momentum also faded before the high from yesterday (which was below the low from last week).
Are the sellers ready to take more control? Get below the 200 hour moving average and stay below will be eyed. Then traders can look toward the lows from today and Friday near 0.9033..
