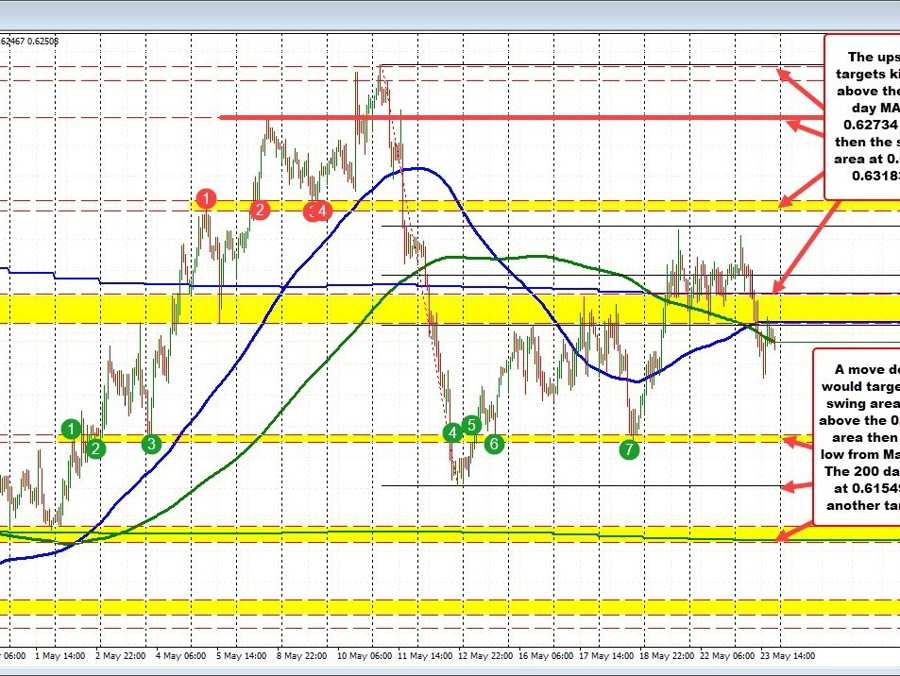
NZDUSD trades around 100/200 hour MA
The NZDUSD pair has been trading at lower rates today, slipping beneath its 100-day moving average at 0.62734 and 100-hour moving average of 0.6259. However, it’s been fluctuating around its 200-hour moving average of 0.62505 and is currently positioned at 0.6247, indicating a slight downward bias. As we approach the Reserve Bank of New Zealand’s (RBNZ) central bank meeting, this fluctuation provides a technically neutral and safe trading ground.
The RBNZ, in their upcoming meeting, is projected to maintain its trend of rate hikes, with 21 out of 25 economists surveyed by Reuters predicting a 25 basis point (bps) increase to the Official Cash Rate (OCR), pushing it up to 5.50%. Yet, money markets suggest approximately a 40% likelihood of a more aggressive 50bps increase. This echoes the previous RBNZ meeting where rates were raised by an unexpected 50bps.
The RBNZ has pledged to sustain its tightening cycle to bring inflation back within its target band of 1%-3%. However, a softer-than-anticipated Consumer Price Index (CPI) and subdued inflation expectations might result in a slower pace of rate hikes. The Q1 CPI came in at 1.2% and 6.7% Year-on-Year, below the forecasted 1.7% and 7.1%. Nevertheless, considering the present inflation level is still beyond the bank’s target range, and in light of New Zealand’s recent budget which encompassed substantial fiscal measures, further rate hikes are likely.
The forthcoming rate decision and the related statement will offer insight into future policy direction. Should indications of additional rate hikes persist, the New Zealand Dollar (NZD) could gain strength, and we might see an upward revision to the peak rate forecast of 5.50%.
If the RBNZ opts for a 50bps hike or maintains a hawkish stance, breaking above the 100-day moving average at 0.62734 would give the buyers a firmer grasp, with the next target being the swing area between 0.6313 and 0.63183, followed by the swing highs from May 8 and May 11 at 0.6358 and 0.63835 respectively.
On a less hawkish outcome, traders will be closely watching the 0.6202 – 0.62059 swing area. Falling below that would put the low price from May 12 at 0.61813 and another swing area near 0.6154 – 0.61619 in focus. Also noteworthy is the pair’s 200-day moving average, which is currently close to the lower swing area at 0.6154.
