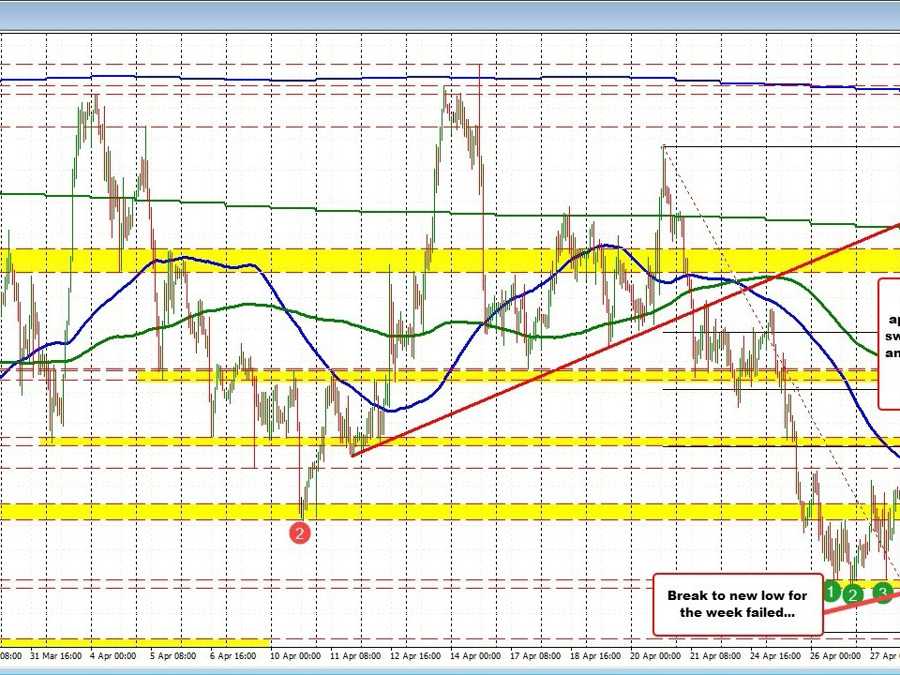
AUDUSD rebounds after break to new low fails.
The AUDUSD experienced a decline during the Asian and early European trading sessions, following a successful test of the 100-hour Moving Average (MA) during the initial upward movement (refer to the blue line on the hourly chart above). This prompted traders to lean against the risk-defining level, leading to the currency pair’s subsequent drop.
The decline surpassed the lows from March 24 and April 11, ranging between 0.66188 and 0.66253, as well as the weekly lows between 0.6591 and 0.6595. The downward extension reached 0.6573 before reversing and moving back upwards. The currency pair is currently trading at 0.6615 and appears poised to retest the swing lows from March 24 and April 11 between 0.66188 and 0.66253. The subsequent 100-hour moving average is at 0.66295.
If the price moves above both of these levels and then surpasses the day’s high (which once again tested the 100-hour moving average), it will bolster buyer confidence. On the other hand, if sellers maintain pressure against this area, they will remain in firm control.
Examining the daily chart below, we can see that sellers have been driving the price downwards over the past seven or so trading days, entering a swing area between 0.6544 and 0.65847. Within this range lies the swing low from March at 0.65639. Today’s low price of 0.6573 came within 10 pips of this 2023 low. Traders have shown support against this area on the first test.
The battle is on with support coming from the daily chart, and resistance from the hourly chart.
GBPUSD tested the low from 2023
