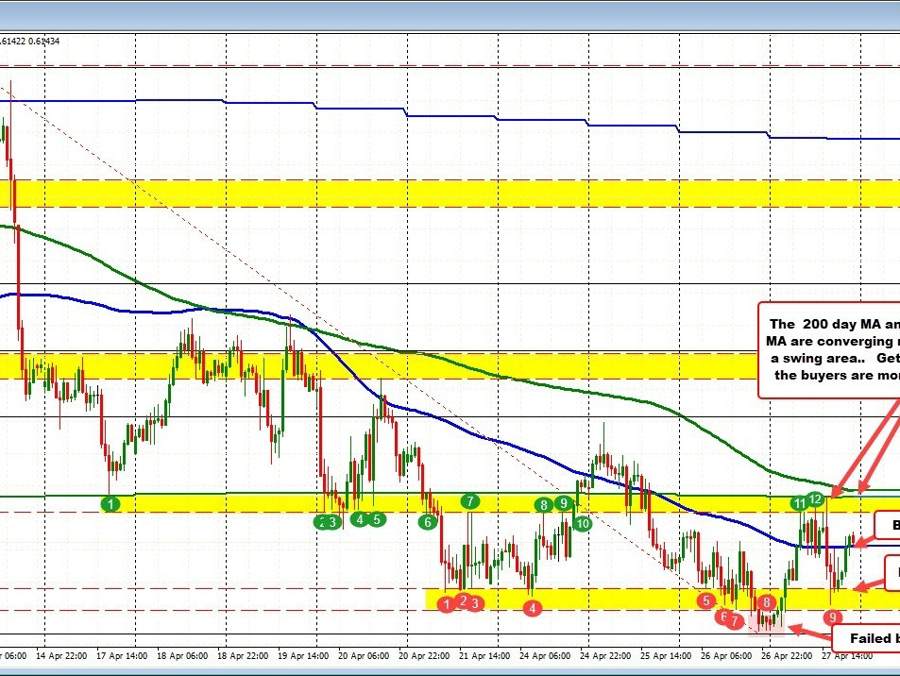
NZDUSD consolidates an up-and-down trading between levels
The NZDUSD has experienced a rollercoaster of price action today, with values initially staying above yesterday’s low of 0.61107 before climbing higher. This upward momentum managed to surpass a critical swing area between 0.6119 and 0.61266, as sellers became buyers. During the Asian and early European sessions, the price continued to rise above the 100-hour moving average, reaching another swing area between 0.6154 and 0.61595. At the upper end of this range, the 200-day moving average looms, with a declining 200-hour moving average just above it at 0.61618.
As a result of the stalling at the 200-day moving average, the price fell back below the 100-hour moving average, returning to the lower swing area between 0.6119 and 0.61266, before returning back to the upside, and currently back above the 100 hour moving average at 0.61419.
With this oscillating price action, the market appears non-trending and directionless. However, technical levels have been reasonably effective in defining boundaries.
- The 200-day moving average, followed by the 200-hour moving average (currently between 0.6159 and 0.61618), serves as the upper limit,
- The swing area between 0.6119 and 0.61266 provides a lower boundary.
- The 100-hour moving average, set at 0.61419, lies in between and is an interim barometer for buyers and sellers.
As the new trading day approaches, the 100-hour moving average will act as a crucial gauge for bullish or bearish sentiment. Above and below that level, and traders will keep a close eye on the aforementioned extremes, searching for signs of a breakout. For now, the seesaw price action suggests that market participants are waiting for the next decisive push.
The battle continues.
