NZDUSD trends lower today
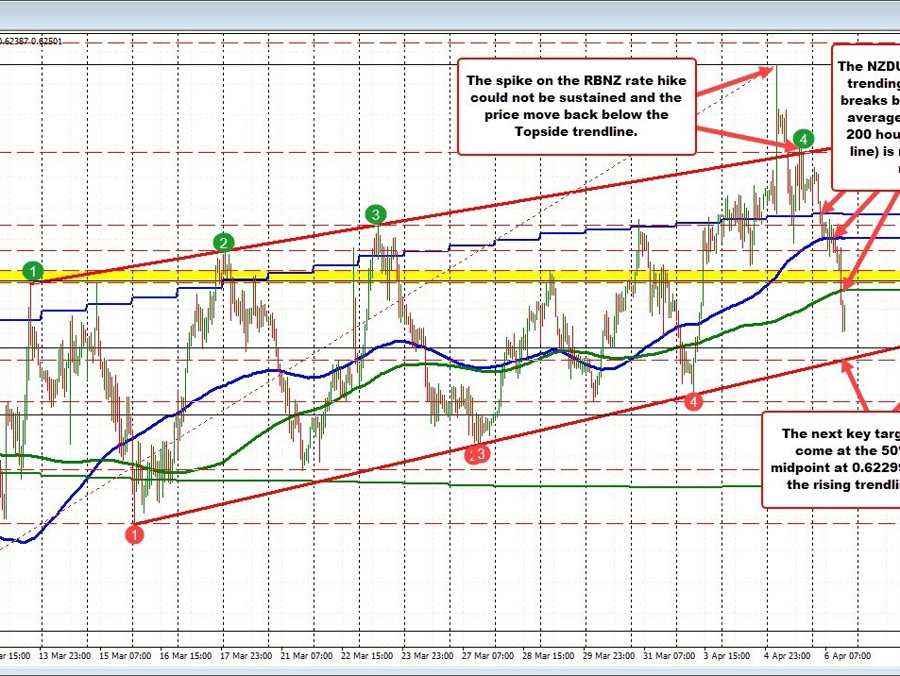
The dollar’s recent strength seen today is being led by a decline in the NZDUSD (higher USD), which is currently down by 1.2% at 0.6245, reaching a low of 0.6238. Technically, during the US session, the NZDUSD broke below a key support area between 0.6263 and 0.62699, as well as the ascending 200-hour moving average (represented by the green line in the chart).
On Monday, the price dipped below this key 200 hour moving average before rebounding from an upward sloping trendline (see red numbered circle 3), as buyers stepped in and reversed the downward momentum. The upward movement peaked yesterday when the RBNZ unexpectedly raised interest rates by 50 basis points, pushing the NZDUSD to a high of 0.63765, its highest level since mid-February. However, the price failed to maintain this momentum and subsequently declined, falling back below an upper trendline.
In today’s steady decline, the NZDUSD has broken below not only the 200-hour moving average but also the 100-day moving average (currently at 0.62989) and the 100-hour moving average (at 0.62865). For the time being, the 200-hour moving average at 0.62598 serves as the close resistance level; remaining below this point indicates a bearish bias. A move above would have traders looking toward the swing area between 0.6263 and 0.62699.
On the downside, the next significant target is the 50% retracement of the rise from the March 8 low, located at 0.62299. If the price falls further, the upward sloping trendline that halted the decline on Monday, currently at 0.62235 (and rising), will come into play. Move below it and the door opens for further downside momentum.
The RBNZ Is the most hawkish of central banks of late. Traders reaction seems to suggest they may be going too far. The technical deterioration has helped define that storyline by its more bearish bias. Having said that, the price action has been filled with lots of ups and downs in a more upward bias. Getting below the 50% and the rising trendline would nevertheless be more bearish.
