- Silver gains strong positive traction on Thursday and touched its highest level since early February.
- The technical setup favours bullish traders and supports prospects for a further appreciating move.
- A convincing break below the $22.00 mark is needed to negate the near-term constructive outlook.
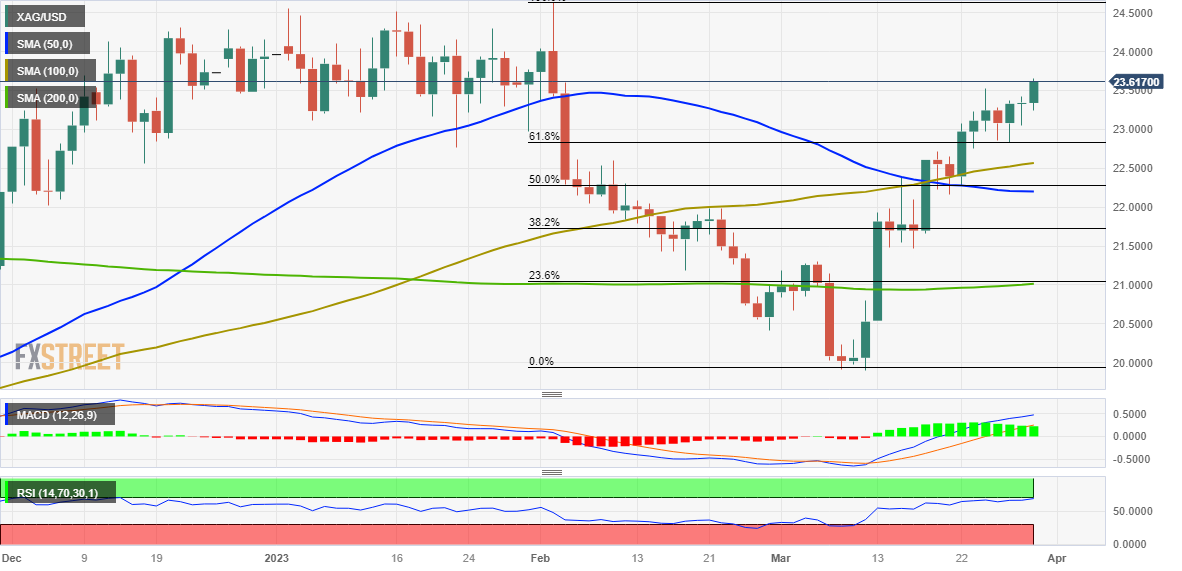
Silver catches fresh bids on Thursday, following the previous day’s two-way/directionless price moves, and rallies to a nearly two-month high during the early European session. The white metal is currently placed around the $23.60-$23.65 region, up over 1% for the day, and seems poised to prolong its recent appreciating move from levels just below the $20.00 psychological mark, or the YTD low touched earlier this March.
Against the backdrop of the recent breakout through the 61.8% Fibonacci retracement level of the pullback from over a nine-month peak, the ongoing positive move adds credence to the bullish outlook for the XAG/USD. Hence, some follow-through strength, back towards the $24.00 mark, looks like a distinct possibility. The momentum could get extended further towards the $24.65 region (multi-month peak touched in February) en route to the $25.00 psychological mark.
That said, Relative Strength Index (RSI) on the 1-hour chart is already flashing overbought conditions and remains close to 70 on 4-hour/daily charts. This makes it prudent to wait for some near-term consolidation or a modest pullback before placing fresh bullish bets. Any meaningful corrective slide, however, might now be seen as a buying opportunity near the $23.00 round-figure mark and remain limited near the 61.8% Fibo. level resistance breakpoint, around the $22.80 area.
The latter should now act as a strong base and a pivotal point, which if broken decisively might prompt some technical selling. A subsequent slide below the $22.50 region could then drag the XAG/USD towards the $22.20 intermediate support en route to the $22.00 round figure. This is closely followed by the $21.75-$21.70 zone. A convincing break below said support levels is needed to negate the positive outlook and shift the near-term bias in favour of bearish traders.

