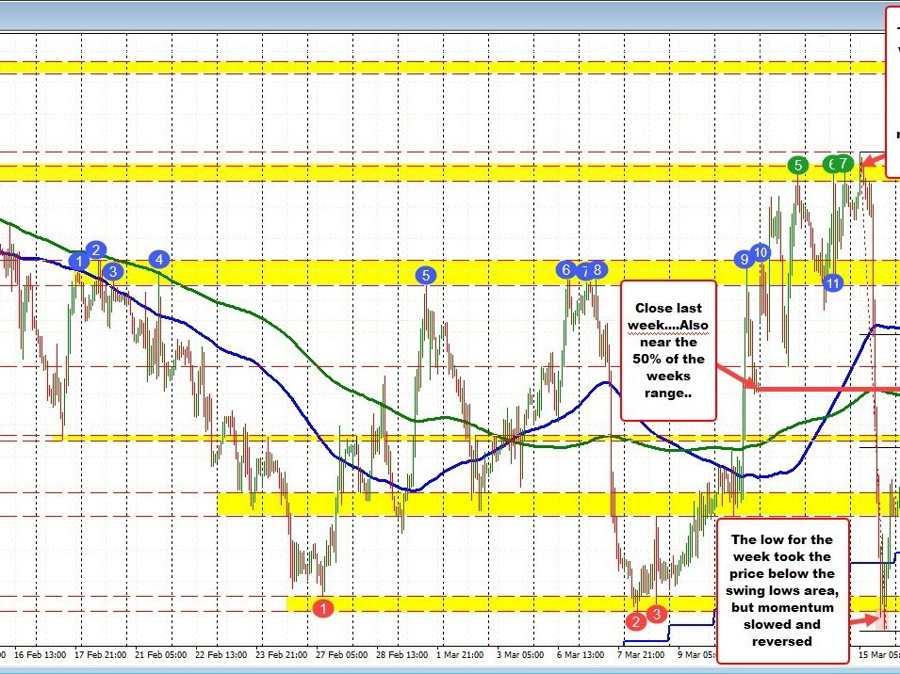
EUSUSD closing higher on the week
IN trading today, the EURUSD moved higher in the Asian session, fell in the European morning session , and is moving higher in the US session.
The move has taken the price positive on the week (it closed at 1.0636 last Friday). Ironically, the close from last week is right near the midpoint of the week’s trading range. However, this week, the pair has its share of ups and downs.
- On Monday the price initially moved higher than lower and then back higher
- Tuesday the pattern was lower than higher.
- On Wednesday after reaching a new high for the week at 1.07592, the price tumbled all the way down to 1.05147 as Credit Suisse became a catalyst and provide a downside tailwind. Expectations for a softer ECB was priced in.
- Thursday the ECB raised rates by a greater than expected 50 basis points. Once again, there was a a volatile up, down and back up day. The price closed higher.
- Today, once again the price moved up and down and back up again. The final move to the upside has taken the pair to new intraday highs.
Technically, the price rise today has now seen the pair extend above its 100 hour moving average at 1.06583, and the 61.8% retracement of the week’s trading range at 1.06658.
Today’s catalysts has been lower US rates which has weakened the US dollar. The two year yield is now down 30 basis points at 3.831%. The 10 year yield is down 20 basis points to 3.382%. Yesterday the trend in rates was the opposite with the US yields moving higher.
What now?
The bias more positive above the 100 hour moving average 1.0658. On the top side, there is a swing area between 1.06908 and 1.0704. Get above that area would increase the bullish bias.
Alternatively, move back below the 100 hour moving average and then below the 200 hour moving average 1.06278, and sellers are back in control.
Next week the Federal Reserve will meet and announce their rate decision on Wednesday. They also will release the dot plot on rate expectations.
Currently, the terminal rate implied by the market is below 5% at 4.95%. Recall in December when the last dot plot was announced, the Fed officials had the terminal rate at 5.11%. So traders have taken out one 25 basis point hike from that December. Having said that, a week or two ago, the expectations for the terminal rate was upwards toward 5.75%. People were talking about a terminal rate of 6% or higher.
That is more dovish of course, but even more dovish is the futures contract for January 2024 are now implying that the Fed will lower rates to 3.95%. That is down about 100 basis points from the terminal rate.
Before the Fed went into the blackout, comments were about the Fed pushing rates toward 5.25% (and for some above), and then being rates steady for an extended period of time (and certainly not before the end of 2023). Now, the market sees the Fed rate moving down by 100 bps.
Wednesday will certainly be an interesting day. The volatility seen this week may certainly be a precursor for what we can expect.
